National Corn Price Index (NCPI)
Weekly Close: $3.5118, up $0.1594. Secondary Trend: Up. Basis: Neutral (versus Dec futures contract). Market Type: 8 = Bullish. Price Distribution: Upper 28% = Bearish. Target: $3.59. Analysis: The NCPI posted a bullish outside range last week as it reestablished is secondary uptrend. The next price target is just above last Friday’s calculation, with the $3.59 price the 50% retracement level of the previous secondary downtrend from $4.46 (week of July 8) through the low of $2.73 (week of April 27). Theoretical Position: Producers: 50% of expected 2020 production is hedged in the Dec futures contract at an average price of $4.08 (see below). As mentioned in the update posted Monday, September 28, another 15% of cash could be sold at NCPI price near $3.36. Sales made daily over this past week would’ve averaged $3.45. We will see how much cash might’ve been sold, theoretically, with the release of NASS Crop Progress report Monday, October 5.
Corn December 2020
Weekly Close: $3.7975, up $0.1450. Secondary Trend: Up. Dec-March Spread: (-$0.0950) = 37% = Neutral. Market Type: 8 = Bullish. Price Distribution: Lower 41% = Neutral. Target:$3.84. Analysis: Dec corn also posted a bullish outside range last week, its high extending past the upside target of $3.84 to $3.8550 before falling back a bit at the weekly close. The contract remains overbought with weekly stochastics near 90%, in position for a potential bearish crossover. Theoretical Position: (NEW!) 50% of expected 2020 production is hedged versus the Dec at an average of $4.08 (see below). Those not wanting to sell cash but put newly harvested bushels in storage can look at making an additional 25% sale with Dec corn near $3.80. Also, those holding Dec futures short hedges can look at rolling to the March futures contract at a carry of 11 cents. National average basis was calculated last Friday at 28.6 cents under Dec (38.1 cents under March), 1.4 cents stronger than the previous week. (PREVIOUS): Expected production for 2020 could be 25% covered at or above $4.15. Another 25% of 2020 pricing could’ve been made at the weekly close near $4.01 (week of December 30, 2019), putting the position at 50% priced with an average of roughly $4.08. The upper 33% of the contract’s historic price distribution range is $4.00. Approximately 75% of 2020 production (U.S.) has a theoretical put against it with the spring base insurance price of $3.88.
Corn March 2021
Weekly Close: $3.8925, up $0.16. Secondary Trend: Up. March-May Spread: (-$0.0550) = 30% = Bullish. Market Type: 8 = Bullish. Price Distribution: Upper 47% = Neutral. Target: $3.93. Analysis: Similar to the Dec contract, March corn posted a bullish outside range last week with the high of $3.94 a test of the next price target at $3.93. Weekly stochastics near 90% continue to show the contract is sharply overbought. Theoretical Position: (NEW!) 50% of expected 2020 production is hedged versus March at an average of $4.22 or $4.18 (see below). National average basis was calculated at 38.1 cents under March last Friday, with the seasonal tendency for basis to firm to an average of 26 cents under through the third weekly close of February. Those not wanting to sell cash could price another 25% of 2020 production with March short hedges near $3.90. (PREVIOUS): 25% of 2020 production could’ve been priced the week of June 24, 2019 near $4.25 based on a secondary key bearish reversal indicating the move to an intermediate term downtrend. Another 25% might’ve been done near $4.19 the week of July 29, 2019 as the contract posted a new 4-week low. If so, 50% would be covered at an average price of $4.22. Otherwise, sales could’ve been made correlating with what was done in the December 2020 contract with 25% priced at the same $4.25 based on a previous calculation of the upper 1/3 of the contract’s price distribution, then near $4.11 the week of December 30, 2019. This puts the average for 50% of expected production at $4.18 with the most recent calculation of price distribution showing the upper 33% at $4.03. Approximately 75% of 2020 production (U.S.) has a theoretical put against it with the spring base insurance price of $3.88 (versus the December 2020 futures contract).
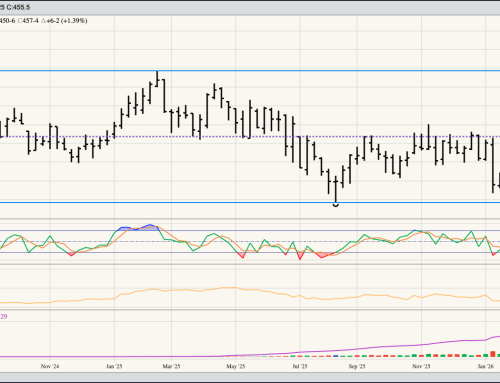
Corn December 2021
Weekly Close: $3.91, up $0.07. Secondary Trend: Up. Dec21-March22 Spread: (-$0.0825) = 32% = Bullish. Market Type: 9 = Most Bullish. Price Distribution: Upper 42% = Neutral. Target:$3.9725. Theoretical Position: Expected production for 2021 could be 25% covered at or above $4.15. Another 25% of expected production was covered when the contract hit $3.89, creating an average price of $4.02 on 50% of expected production. The upper 33% of the contract’s historic price distribution range is $4.00. Catch up sales could’ve been made near the recent weekly close of $3.9325.
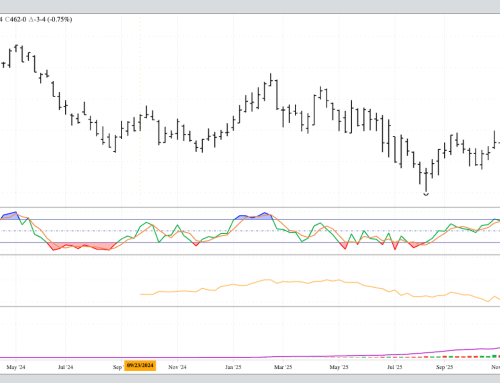
Corn December 2022
Weekly Close: $3.9525, up $0.0350. Secondary Trend: Up. Market Type: 8 = Bullish. Price Distribution: Upper 37% = Neutral. Target: $4.0225. Theoretical Position: Expected production for 2022 could be 25% covered at or above $4.15. Another 25% of expected production was covered when the contract hit $3.96. This created an average price of $4.05 on 50% of expected production. The upper 33% of the contract’s historic price distribution range is $4.00. Catch up sales could’ve been made near the recently close of $3.9775, particularly with weekly stochastics establishing a bearish crossover above 90%.