


Theoretical Positions: The bulk of 2023 production has been priced with cash contracts or short futures hedges. Dec23 short hedges would’ve been rolled to March24 at a strong carry during November. March short hedges could be rolled to May when the spread covers 67% calculated full commercial carry, roughly 14.52 cents carry, with the spread closing at 13.75 cents carry Friday. Otherwise, March short hedges should be rolled before the March goes into delivery. End users should continue cover needs on an as-needed basis only. I will discuss what to do if still holding old-crop corn unpriced in a Column this weekend.
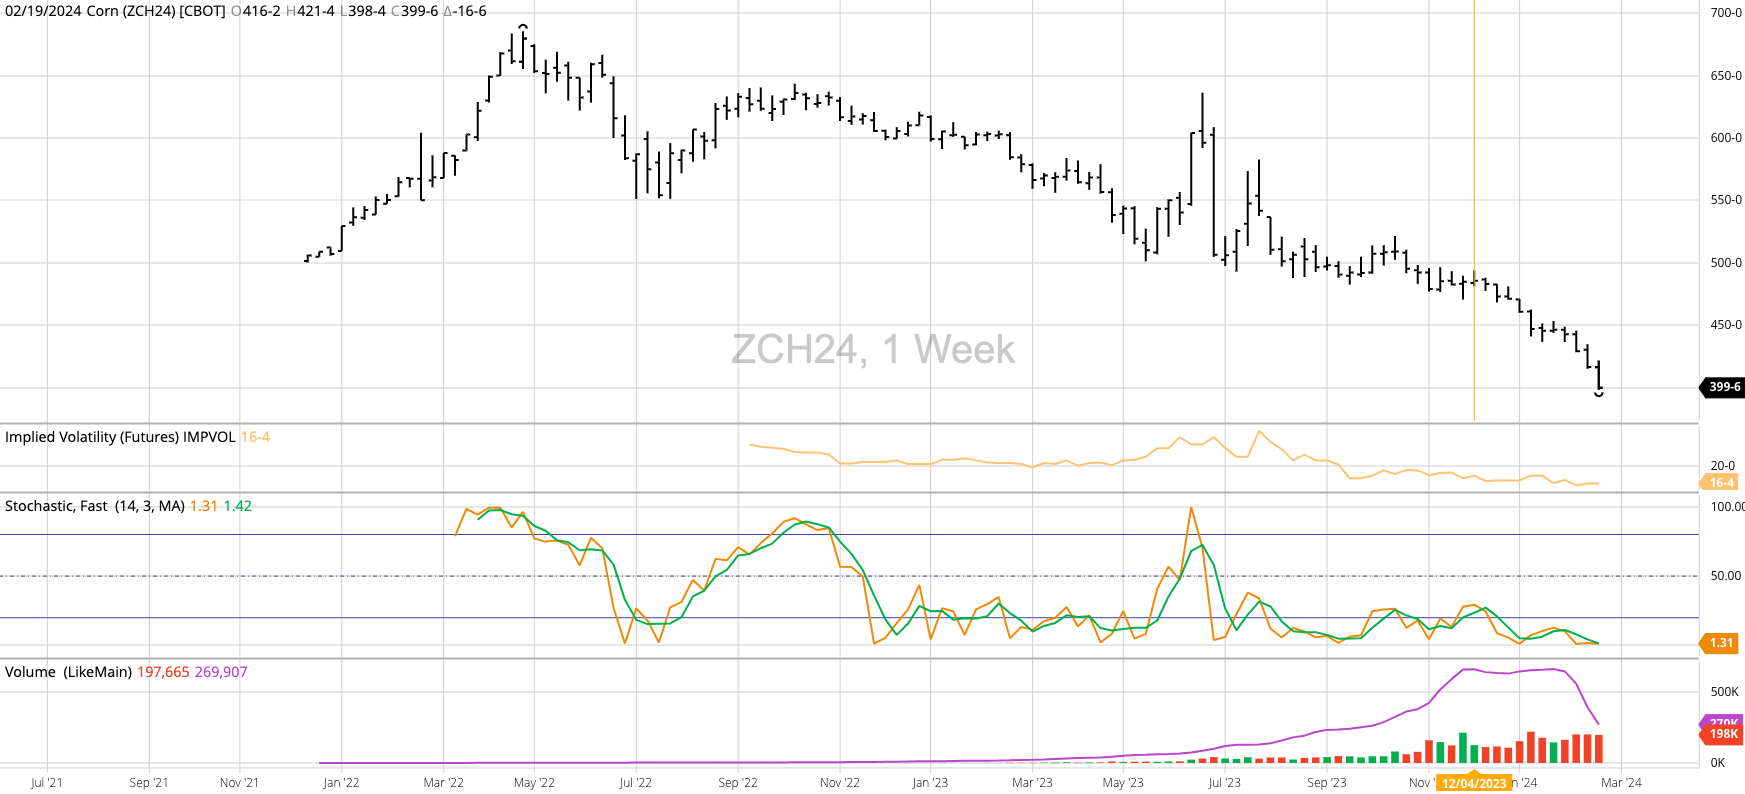
Trend: Down. March corn remains in a secondary (intermediate-term) downtrend as it posted a new contract low of $3.9850 last week before closing at $3.9975. This was the first weekly close below $4.00 by the nearby futures contract since the week of October 26, 2020.
- The Commitments of Traders report showed noncommercial traders increased their net-short futures position by 20,128 contracts, putting it at 266,067 contracts as of Tuesday, February 20 (slide 2).
- This included an increase in long futures of 1,335 contracts
- And an increase in short futures 0f 21,463 contracts
- This was a new record large noncommercial net-short futures position, driven predominantly by adding new short futures.
- Funds are not afraid of being short corn at this time.
Fundamentals: Neutral-Bearish
- The National Corn Index (national average cash price) came in Friday evening near $3.8025
- Putting available stocks-to-use at 13.3% (Bearish)
- Friday’s national average basis calculation came in at 19.5 cents under March futures
- as compared to the previous Friday’s figure of 20.0 cents under March
- with the previous 5-year average weekly close for last week at 15.5 cents under March
- and the previous 5-year low weekly close for last week at 35.0 cents under March
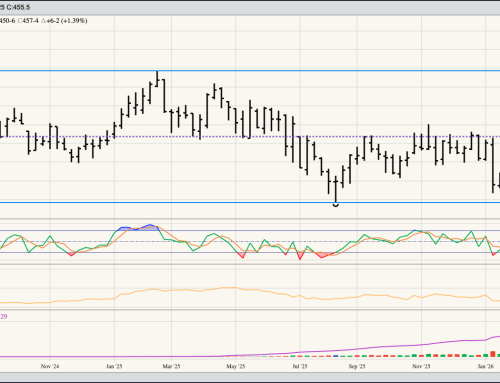
- Futures spreads covered a neutral-to-bearish level of calculated full commercial carry (cfcc)
- The March-May futures spread (slide 3) closed at a carry of 13.75 cents and covered roughly 65% cfcc (with 67% or more considered bearish)
- as compared to the previous week’s 13.0 cents and 61% cfcc
- The spread will theoretically hit 67% cfcc at a carry of 14.25 cents
- The May-July futures spread closed at a carry of 12.75 cents and covered 62% cfcc
- as compared to the previous week’s 10.75 cents and 51.5% cfcc
- The spread will theoretically hit 67% cfcc at a carry of 14.0 cents
- The March-May futures spread (slide 3) closed at a carry of 13.75 cents and covered roughly 65% cfcc (with 67% or more considered bearish)
Seasonals: Bullish
- The National Corn Index (national average cash price) tends to rally from the last weekly close of September through the second weekly close of June (slide 4)
- The 5-yer index shows an average gain of 24%
- The 10-year index shows an average gain of 18%
- The 2024 market remains in a contra-seasonal downtrend, posting a new low weekly close last Friday near $3.8025
- March corn tends to trend up from late September through late February
- The 2024 contract remains in a contra-seasonal downtrend
Price Distribution: Neutral-Bullish (Weekly closes only from 2019 through 2024)
- The National Corn Index (slide 5) priced near $3.8025 put it in the lower 31% of its price distribution range
- With the bullish lower 33% threshold at $3.95
- March 2024 closing at $3.9975 put it in the lower 32% of its price distribution range
- With the bullish lower 33% threshold at $4.02
Volatility: High
- The implied volatility on the July daily chart was 23.4% at last Friday’s close.
- At the high end of its range
Conclusion: The key factor is funds have no fundamental reason to fear adding to their net-short futures positions. Our key fundamental reads (National Cash Index, basis, futures spreads) are growing more bearish, for the most part. At some point we should expect a short covering rally, even if only short term, but the market is giving no sign of it yet.