Theoretical Positions: 2023 production has been priced with cash contracts or short futures hedges. Dec23 short hedges would’ve been rolled to March24 at a strong carry during November. March short hedges were rolled to May when the spread at 14.25 cents carry. At least some of the May short hedges were rolled forward to July when the spread hit 14.0 cents carry. It’s possible some July short hedges were rolled to September at a carry of 10.0 cents. If still holding short hedges versus September, we need to be careful as national average basis continued to weaken versus September futures. Sooner rather than later, those bushels should be sold and short hedges lifted as we move on to the 2024 crop.
- End-Users:
- At this point, continue to buy on an as needed basis given the seasonal secondary downtrend in the National Corn Index.
- Despite the NCI priced in the lower 25% of its distribution range.
- Keeping an eye out for an intermediate-term or long-term bullish turn in the market.
- At this point, continue to buy on an as needed basis given the seasonal secondary downtrend in the National Corn Index.
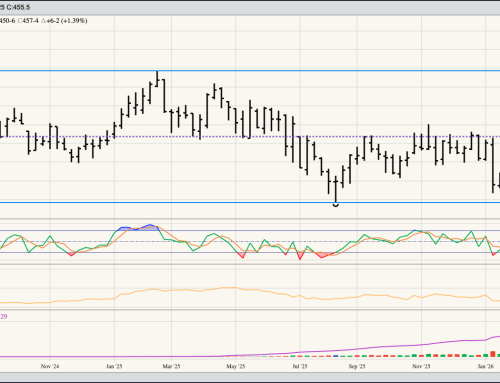
Trend: Down. Despite being already oversold, the September issue extended its secondary (intermediate-term) downtrend to a low of $3.7525 before closing Friday at $3.7675, down 9.75 cents for the week. Based on corn’s characteristic Round Number Reliance, September could now target $3.70.
- The Commitments of Traders report showed noncommercial traders held a net-short futures position of 151,969 contracts, a decrease of 60,473 contracts as of Tuesday, August 6 (slide 2).
- This included an increase in long futures of 11,770 contracts
- And a decrease in short futures by 48,703 contracts
Fundamentals: Neutral
- The National Corn Index (national average cash price) came in Friday evening near $3.6650
- Putting available stocks-to-use at 13.6%
- Friday’s national average basis calculation came in at 10.25 cents under September futures
- as compared to the previous Friday’s figure of 8.75 cents under September
- with the previous 5-year low weekly close for last week at 21.75 cents under September futures
- and the previous 5-year average weekly close for last week at 39.0 cents over September futures
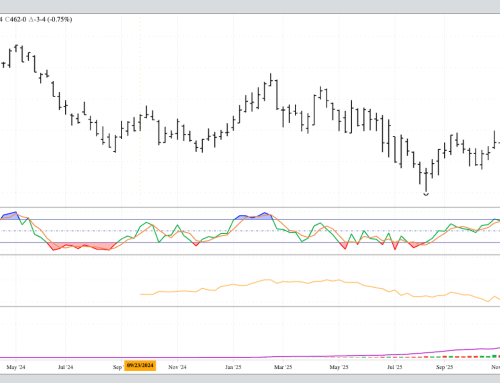
- The September-December futures spread closed at a carry of 18.25 cents (slide 3) and covered 58% cfcc
- as compared to the previous Friday’s 16.75 cents carry and 53% cfcc
- Indicating continued selling from commercial traders
Seasonals: Bearish
- The National Corn Index (national average cash price) tends to fall from the second weekly close of June through the last weekly close of September (slide 4)
- With the 5-year index (red line on chart) showing an average drop of 24%
- and the 10-year index (blue line on chart) showing an average drop of 18%
- since posting a high weekly close of $4.46 the second week of May
- the NCI dropped 18% through this past Friday’s calculation near $3.6650
Price Distribution: Bullish (Weekly closes only from 2019 through 2024)
- The National Corn Index (slide 5) priced near $3.6650 put it in the lower 23% of its price distribution range (green column)
- With the lower 33% level starting near $4.00
Volatility: High
- Implied volatility on the September daily chart finished Friday at 28%, near the high end of its range
Conclusion: Despite being technical oversold and fundamentally underpriced (distribution), old-crop corn continues to move lower. The bottom line is available stocks-to-use continue to grow ahead of the next harvest, giving no reason for the market to rally at this time. Still, it could, as we saw funds are willing to cover some of their net-short futures position.