This analysis is using the Barchart National HRW Wheat Price Index (HWPI, weighted national average cash price)
- Trends
- Minor (Short-term): Up on the HWPI daily chart
- Though could quickly be moving into a Wave 2 selloff of the 5-wave uptrend pattern.
- This puts support at the last week’s low near $8.02
- Secondary (intermediate-term): Up on the HWPI weekly chart
- Last week saw the HWPI post a bullish spike reversal pattern, confirming a new secondary uptrend
- The upside target area is between $9.88 and $10.52
- The HWPI was calculated last Friday at $8.96
- Major (long-term): Down on the HWPI monthly chart, based on the July move to a new 4-month low below $9.07
- Given this, the new secondary uptrend would be viewed as Wave B (second wave) of the major 3-wave downtrend pattern
- Minor (Short-term): Up on the HWPI daily chart
- Fundamentals
- Short-term: Bearish
- The Barchart National HRW Wheat Basis Index was calculated at 49.7 cents under September Kansas City futures last Friday
- As compared to the previous 4-year low weekly close of 21.5 cents under
- With the 2017-2018 weekly close for the same week coming in at 66.8 cents under
- The Barchart National HRW Wheat Basis Index was calculated at 49.7 cents under September Kansas City futures last Friday
- Long-term: Bullish
- 2022-2023 marketing year futures spreads are covering less than 33% calculated full commercial carry
- Short-term: Bearish
- Noncommercial Activity
- The latest CFTC Commitments of Traders report (legacy, futures only) showed noncommercial traders reducing their net-long Kansas City (HRW) futures position to 17,900 contracts
- This leaves the door open to continued long-liquidation due to bearish short-term fundamentals
- Eventually this group should return as buyers due to bullish long-term fundamentals
- The latest CFTC Commitments of Traders report (legacy, futures only) showed noncommercial traders reducing their net-long Kansas City (HRW) futures position to 17,900 contracts
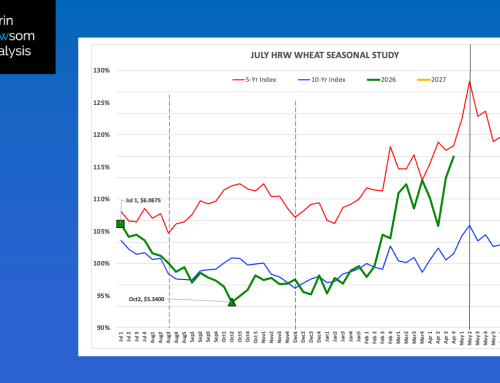
- Seasonality
- Bearish
- After posting an initial seasonal low weekly close in late June, the HWPI tends to rally 5% through late July
- Then fall 6% through the first week of September
- At that point the 5-year seasonal index turns bullish
- Bearish
- Price Distribution
- Bearish
- Last Friday’s calculation of the HWPI ($8.96) put it in the upper 6% of the 5-year distribution range
- This is a bit skewed as the HWPI moved to a new all-time high during 2021-2022
- With the upper 33% coming in at $5.30
- Bearish
- Implied Volatility
- September futures: 46% = High
- December futures: 39% = High
Theoretical Position
- It’s likely anywhere from 33% to 50% of 2022 production was forward contracted.
- Some have reported 33% was forward contracted, that turned out to be 100% of production. Almost always a problem with wheat.
- Those familiar with the unlimited risk/limited reward nature of short options could look at selling September call options
- Base on high implied volatility of September futures
- The seasonal tendency to post a July high and late August low weekly close
- If exercised, these positions would be used as sales of bushels still held
- If wanting to sell cash, the upside target area for the HWPI is $9.88 to $10.52
- That puts September futures $10.41 and $11.06
- The contract reached a high of $9.9825 overnight through early Monday morning
- That puts September futures $10.41 and $11.06
- Those looking to renown could wait for the short-term Wave 2 selloff, or
- The seasonal downturn through late August
- The DNAI in-house algorithm is showing a theoretical
- Short-term long futures position (and adding to its position)
- Intermediate-term short futures position (neutral)