Cash Soybeans: The cmdty National Soybean Price Index (NSPI) closed at $7.25, down 31 1/2 cents for the week. The NSPI remains in a strong contra-seasonal secondary (intermediate-term) downtrend, with its sights now set on major support at $7.11. This price marks the low from September 2018 on the market’s long-term monthly chart. Monthly stochastics (a long-term momentum study) have moved below the oversold level of 20%, setting the stage for a potential major double-bottom pattern, if the NSPI can hold above its previous major low. Position: 2018-2019 cash soybeans are 100% sold.
Soybeans July 2019 (old-crop): The contract closed at $8.09 1/4, down 33 cents for the week. July soybeans posted a new contract low of $8.06 1/4 before closing near that price. Weekly stochastics are still bullish, in single-digits, hinting at a potential bullish turn in the market at some point. The market’s long-term continuous monthly chart (still registering the May contract that expires Tuesday, May 15) shows major support at $7.76 1/4, the low from December 2008. Friday’s close by the May contract was $7.97. Fundamentally the old-crop market remains bearish, with the July-to-August spread closing at a carry of 6 1/2 cents, covering roughly 71% of calculated full commercial carry. National average basis firmed by about a 1/4 cent last week, coming in Friday evening near 84 1/4 cents under the July. Position: National average basis continued to appreciate into July hedges, with a seasonal top expected in late July. Support for basis is at the low weekly close of 86 cents under. A weekly close below that mark would be a signal to sell cash and lift July hedges.
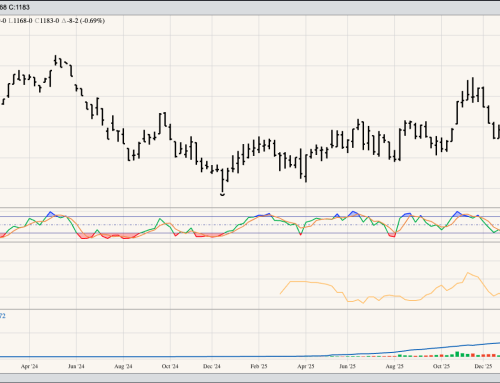
Soybeans November 2019 (new-crop): The contract closed at $8.33 1/4, down 31 cents for the week. New-crop November soybeans posted a new contract low of $8.30 before closing near that mark last week. This after posting a bearish gap down between the previous week’s low of $8.62 1/2 and last week’s high of $8.58. Though everything about the contract looks bearish at this time, weekly stochastics are bullish, well below the oversold level of 20% in single-digits. This would indicate a potential bullish turn could be seen in the near future. It is possible the next couple weeks could see the contract establish either a bullish 2-week reversal, island-bottom, both, or neither. The contract remains in a strong contra-seasonal downtrend, with at least some of the pressure coming from continued commercial selling. The carry in the November-to-July forward curve continues to strengthen, closing last week at 13 1/2 cents and covering roughly 53% of calculated full commercial carry (based on CME’s revised storage rate of 8 cents per bushel per month staring in November). Position: 2019 production is 25% covered with November futures at $9.57. The base insurance price was calculated at $9.54, generally establishing a put option on roughly 75% of expected production.
Canola July 2019 (old-crop): The contract closed at $435.80, up $3.20 for the week. After posting another new contract low of $427.50 last week, July canola was able to close higher. This move looks to be a bullish spike reversal, and when combined with the previous week’s bullish crossover by weekly stochastics below the oversold level of 20% would suggest the secondary (intermediate-term) trend has turned up. If so, initial resistance is at the 4-week high of $465.90, with support at the new contract low. Position: 2018 production is 100% sold. End-users can continue to buy on an as-needed basis until a buy signal is established.
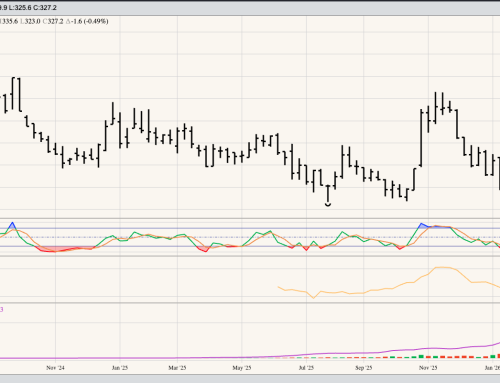
Canola November 2019 (new-crop): The contract closed at $448.90, up $2.00 for the week. Similar to old-crop July, new-crop November posted a new contract low of $441.90 last week before closing higher. This creates what looks to be a bullish spike reversal on its weekly chart, and along with the previous week’s bullish crossover by weekly stochastics below the oversold level of 20%, indicates the secondary (intermediate-term) trend has turned up. Initial resistance is near $470.80, a price that marks the 38.2% retracement level of the previous downtrend from $517.60. Position: 2019 production is 25% covered at $507.10 from the week of July 9, 2018.
Soybean Oil July 2019: The contract closed at 26.79, down 0.56 for the week. July soybean oil extended its secondary (intermediate-term) downtrend to a new contract low of 26.43 last week before rallying at the close. This allowed weekly stochastics to establish a bullish crossover below the oversold level of 20%, an indicator the secondary trend could soon turn up. Confirmation would be a move to a new 4-week high beyond 29.32. Position: There are no positions at this time. End-users can continue to buy on an as needed basis until a new uptrend is confirmed. Those looking to buy could do so near Friday’s close with a stop below the new contract low.
Soybean Meal July 2019: The contract closed at $287.30, down $10.90 for the week. July soybean meal extended its secondary (intermediate-term) downtrend to a new contract low of $286.50 last week. Major (long-term) support on the market’s monthly chart is at $255.70, the low from February 2016. The May contract, set to expire Tuesday, May 15 but still registering on the monthly chart, closed at $284.10. Position: There are no positions at this time. End-users can continue to buy on an as needed basis.