Market Type: 3 (Less Bearish)
- Trends
- Secondary (intermediate-term): Down (3-wave pattern)
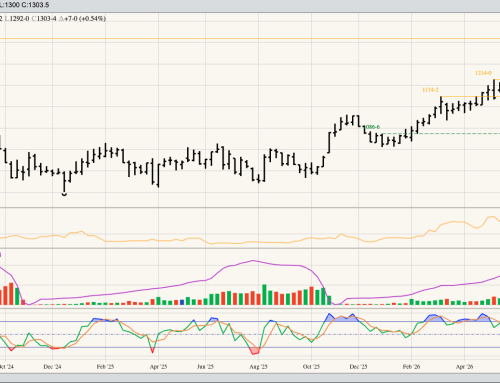
- The contract broke below trendline support at $13.65 early in Sunday’s overnight session
- This completes the bear flag pattern
- And projects a pattern downside target of $11.61
- Not this would be in line with the 50% retracement level near $11.5325
- The previous 4-week low is $12.4750
- The secondary Wave A low is $12.4050
- With Wave C expected to take out Wave A to complete the 3-wave pattern
- The 38.2% retracement level is $12.3025
- With Wave C expected to take out Wave A to complete the 3-wave pattern
- Noncommercial traders increased their net-long futures position the week ending Tuesday, July 20
- The position was reported at 137,679 contracts, an increase of 7,037 contracts
- Long futures were increased by 5,017 contracts
- Short futures were decreased by 2,022 contracts
- The position was reported at 137,679 contracts, an increase of 7,037 contracts
- The contract broke below trendline support at $13.65 early in Sunday’s overnight session
- Major (long-term): Down
- Bearish spike reversal on monthly charts at end of May
- Downside target area (NSPI) is between $13.0625 and $11.9183
- The NSPI was calculated at $13.8692 last Friday
- Secondary (intermediate-term): Down (3-wave pattern)
- Fundamentals
- Bullish
- Nov21-to-July22 forward curve showing an inverse of 11 cents
- However the trend is down (weakening inverse)
- With last Friday’s close off 14.5 cents for the week
- Nov21-to-July22 forward curve showing an inverse of 11 cents
- Bullish
- Seasonality
- Bearish
- Nov Soybeans 5-year tends to top second week of June
- Drops 7% through the second weekly close of August
- Nov Soybeans 10-year tends to top the second week of June
- Drops 5% through the last week of September
- Nov 21 target low weekly close of $12.25 the second week of August
- Closed last Friday at $13.5175
- Nov Soybeans 5-year tends to top second week of June
- Bearish
- Price Distribution
- Bearish
- Nov21 at $13.5175 puts it in the upper 10% based on weekly closes only back through 2011
- Nov22 at $12.4950 puts in in the upper 24%
- Bearish
- Implied Volatility
- High
- Nov Soybeans ~ 26%
- High volatility tends to reflect increased noncommercial activity
- High volatility generally means option premiums are overvalued
- Nov Soybeans ~ 26%
- High
- Theoretical Positions
- 2020-2021
- All remaining cash could’ve been sold at the end of May with the cmdty National Soybean Price Index (NSPI, weighted national average cash price) calculated near $15.16.
- Based on major bearish spike reversal by the NSPI on its monthly chart
- The NSPI posted a new 4-month low of $12.9239 during June.
- All remaining cash could’ve been sold at the end of May with the cmdty National Soybean Price Index (NSPI, weighted national average cash price) calculated near $15.16.
- 2021-2022
- It’s possible 25% of expected production was priced on a trailing stop last week as November soybeans took out its previous 4-week low of $13.2575.
- Another 25%, or catchup sales, could be priced on confirmation of Wave C with a break below trendline support at $13.56 this week.
- It’s possible 25% of expected production was priced on a trailing stop last week as November soybeans took out its previous 4-week low of $13.2575.
- 2022-2023
- It’s possible 25% of expected production was priced on a trailing stop last week as Nov22 soybeans took out its previous 4-week low of $12.06
- Another 25%, or catchup sales, could be priced this week.
- It’s possible 25% of expected production was priced on a trailing stop last week as Nov22 soybeans took out its previous 4-week low of $12.06
- 2020-2021