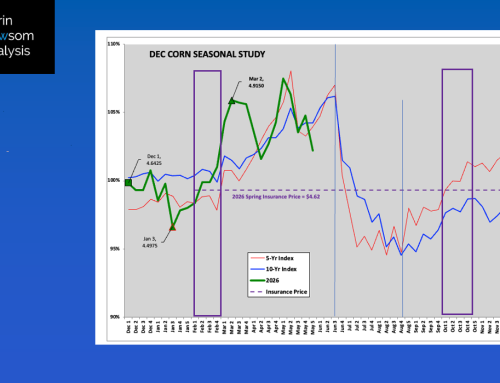
Cash Corn: The National Corn Index (NCI) closed at $3.48, up 4 cents for the week. The Barchart National Corn Index continues to hold below resistance near $3.55 1/4, a price that marks the 73.6% retracement level of the previous downtrend from $3.74 1/4 through the low of $2.96 1/2. Weekly stochastics are back above 90%, indicating the cash index is sharply overbought. Seasonally cash corn tends to post its high in the late April (5-year) to late May (10-year) timeframe, though this marketing year’s rally has been stronger than normal. National average basis firmed by about 1/2 cent to 33 3/4 cents under the March. Position: 2018-2019 cash corn is 100% sold.
Corn March 2019 (old-crop): The contract closed at $3.81 3/4, up 3 1/2 cents for the week. March corn remains in a secondary (intermediate-term) sideways trend with resistance at the recent high of $3.87 3/4 and support last week’s low of $3.71. Weekly stochastics are neutral near the 60% level. March corn gained a 1/4 cent to the May contract with the spread closing at a carry of 8 1/4 cents. This is roughly 62% of the calculated full commercial carry of 13 1/4 cents, or a neutral-to-bearish reading on short-term fundamentals. Position: For those familiar with a short option position, 2018 corn could be 100% short March $3.90 call options from the week of October 15.
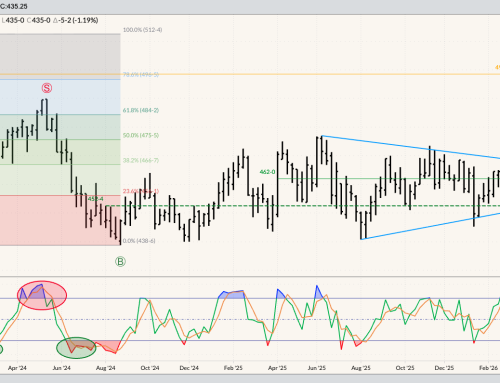
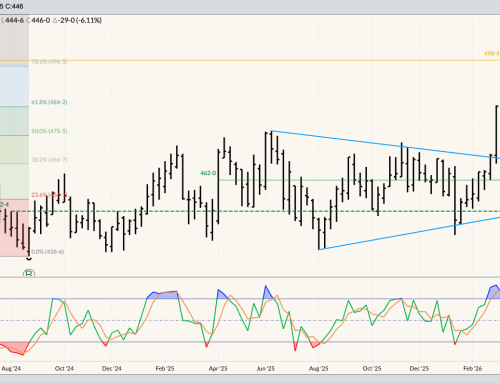
Corn December 2019 (new-crop): The contract closed at $4.03 3/4, up 2 1/4 cents for the week. Though new-crop December corn remains in a secondary (intermediate-term) sideways trend, last week saw the contract post a bullish outside trading range. This would indicate new-crop corn could see continued buying interest, likely to test initial resistance at the recent high of $4.05 1/2. Beyond that resistance is near $4.08. Weekly stochastics have moved back above 70% and could soon challenge the overbought level of 80%. Keep in mind that according to Dec corn’s 6-year price distribution table its historic upper-third is at $4.15. The December 2019-to-July 2020 forward curve saw its carry weaken slightly, closing at 18 3/4 cents. This is roughly 39%, a neutral-to-bullish level of the full commercial carry calculation of 47 1/4 cents. Position: 25% forward contracted at $4.03 (based on seasonality), or for those familiar with short options positions could be 50% of expected 2019 production short $4.10 short-dated new-crop July call options from the week of October 15.
Oats March 2019: The contract closed at $2.98 3/4, up 4 cents for the week. Despite another higher weekly close the contract remains in a secondary (intermediate-term) downtrend. So far March oats have held support at $2.69, a price that marks the 61.8% retracement level of the previous uptrend from $2.39 (week of July 16) through the high of $3.17 1/2 (week of November 19). The contract is testing resistance between $2.94 1/4 and $2.99 3/4, prices that mark the 50% and 61.8% retracement levels of the initial sell-off from $3.17 1/2 through the low of $2.71 1/4. The 76.4% retracement level is up at $3.06 1/2. Weekly stochastics are neutral-to-bullish, with the last signal a bearish crossover above the overbought level of 80% the week of October 22. Position: 2018 production is 100% sold.
Rice March 2019: The contract closed at $10.625, down $0.145 for the week. March rice remains in a secondary (intermediate-term) sideways trend between the low of $10.00 (week of September 17) and high of $11.41 (week of October 15). The contract continues to hold near the midpoint of this range at $10.70.