Cash Soybeans: The National Soybean Index (NSI) closed at $8.24 3/4, up 5 3/4 cents for the week. Despite its higher weekly close the Barchart National Soybean Index (NSI) remains in a secondary (intermediate-term) downtrend. Confirmation of this would be a move below the 4-week low near $7.85 1/2. Support is still at the 4-week low near $7.85 1/2 with initial resistance the 4-week high of $8.37. Beyond that is the peak of the previous uptrend near $8.41 1/2. Weekly stochastics remain bearish above the overbought level of 80%, indicating increased selling interest could soon be seen. National average basis weakened another 3/4 cent last week, finishing at 92 cents under the futures market. Position: 2018-2019 cash soybeans are 100% sold.
Soybeans March 2019 (old-crop): The contract closed at $9.16 3/4, up 6 1/2 cents for the week. Despite its higher weekly close old-crop March corn still looks to be in a secondary (intermediate-term) downtrend with initial support at the 4-week low of $8.80 1/2. The carry in the March-to-July forward curve weakened by 1/4 cent last week to 25 3/4 cents, still covering a bearish 74% of calculated full commercial carry of 34 3/4 cents. Position: Given the strong carry in the old-crop forward curve hedges against 100% of 2018-2019 production could be rolled out or re-established in the July futures contract. Seasonally basis tends to firm through late July.
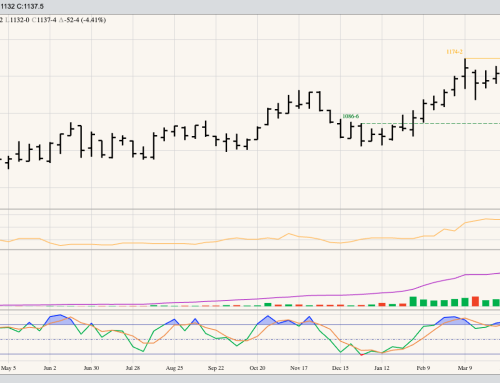
Soybeans November 2019 (new-crop): The contract closed at $9.55 3/4, up 3 3/4 cents for the week. Despite its higher weekly close new-crop November soybeans still look to be in a secondary (intermediate-term) downtrend. This is based on the spike reversal from the week of December 17 that saw the contract post a new high (for the previous uptrend) of $9.71 before closing lower for the week. Resistance remains at that week’s high with support at the 4-week low of $9.23 1/2. The new-crop November 2019-to-July 2020 forward curve saw its carry close at 30 1/2 cents, 2 1/2 cents weaker than the previous week. This remains roughly 42% of the calculated full commercial carry of 72 cents, a neutral read on long-term market fundamentals, but a sizeable weekly move that needs to be watched closely. Position: 2019 production is 25% covered with November futures at $9.57.
Canola March 2019 (old-crop): The contract closed at $484.20, up $0.90 for the week. March canola posted a new 4-week low of $475.00 before rallying to a higher close. This looks to be a classic bullish spike reversal, with confirmation of a possible new secondary (intermediate-term) uptrend a move to a new 4-week high beyond $490.10. Weekly stochastics established a bullish crossover, but above the oversold level of 20%. This leaves the door open to a possible sell-off, not likely to a new low, before the contract confirms its new secondary trend. Position: 2018 production is 100% sold, with futures hedges lifted when the March contract posted its secondary bullish reversal.
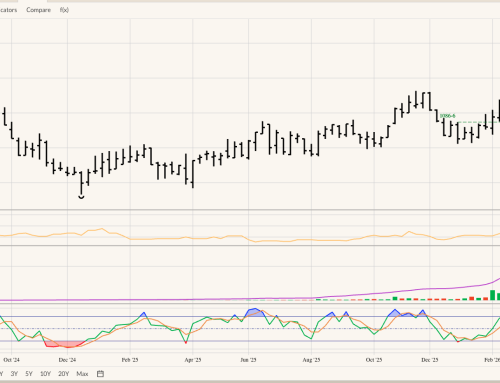
Canola November 2019 (new-crop): The contract closed at $498.40, up $0.20 for the week. New-crop canola remains in a secondary (intermediate-term) sideways trend with resistance at $503.00 (high from the week of September 24) and support $485.60 (low the week of September 17). Position: 2019 production is 25% covered at $507.10 from the week of July 9, 2018.
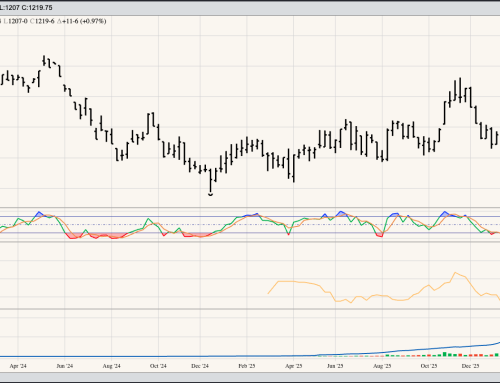
Soybean Oil March 2019: The contract closed at 29.01, up 0.60 for the week. March bean oil remains in a secondary (intermediate-term) uptrend, looking to be firmly in Wave 3 of a 5-wave pattern. Resistance is at the Wave 1 peak of 29.50 from the week of December 10. Weekly stochastics are bullish near the neutral 50% level, indicating the contract has room to build bullish momentum. Position: Long at 28.91 and 28.30 from the weeks of September 17 and November 26 respectively.