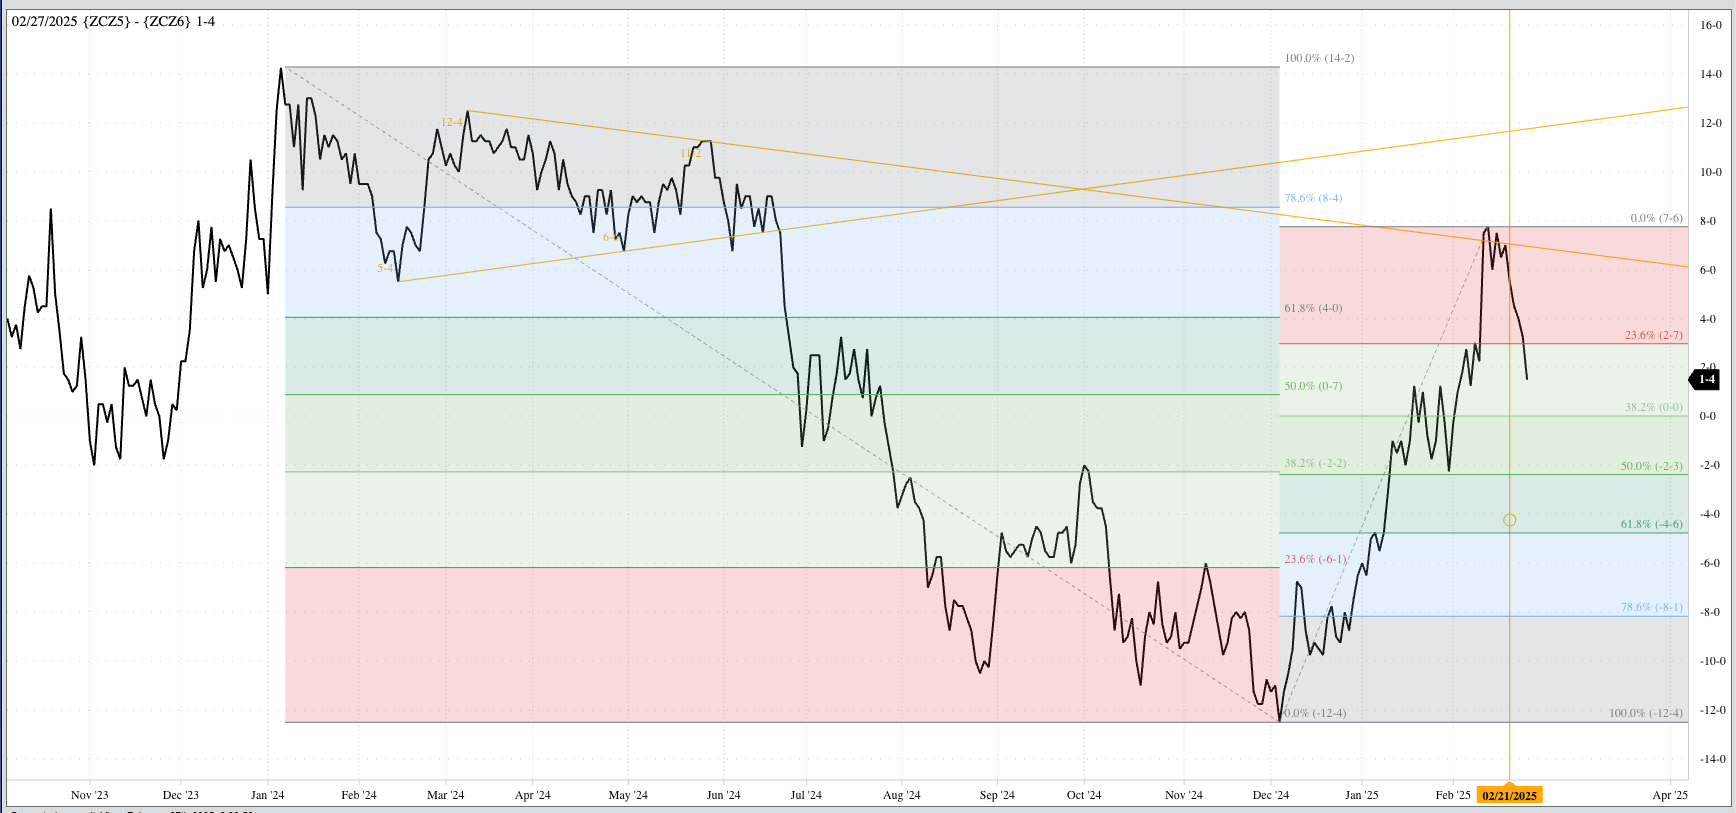
Now that USDA’s Ag Outlook Forum is out of the way, or at least the guessing on 2025 crops part, the spotlight will grow brighter on the Dec25-Dec26 corn futures spread. There is a lot going on here, much of which I’ll cover when talking about long-term Theoretical Positions in Monthly Analysis this weekend, with the bottom line being the spread looks to finally be moving into a downtrend on its daily close-only chart. That being said, and with all the hubbub over acreage projections, potential production, and expected lack of demand due to trade wars, the spread still closed Thursday at an inverse of 1.5 cents. Granted, the recent high daily close was an inverse of 7.75 cents two weeks ago today, but that was another time.

It’s interesting to note, though, the rally to the high daily close on February 13 was a test of trend line resistance created by connecting the highs from March 8, 2024 and May 24, 2024. Before I go too far down this road, recall I’m not big on looking at trend lines.

If we view the spread as now being in a downtrend, after all it posted a new 4-day low daily close at 5.5 cents inverse on Friday, February, then the downside targets are the retracement levels of the previous uptrend from 12.5 cents carry (December 4, 2024) through the 7.75-cent inverse high:

  • 38.2% = Par (Interestingly enough)
  • 50% = Roughly 2.25 cents carry
  • 61.8% = Approximately 4.5 cents carry

Note the previous low daily close was 2.25 cents carry from January 31.