
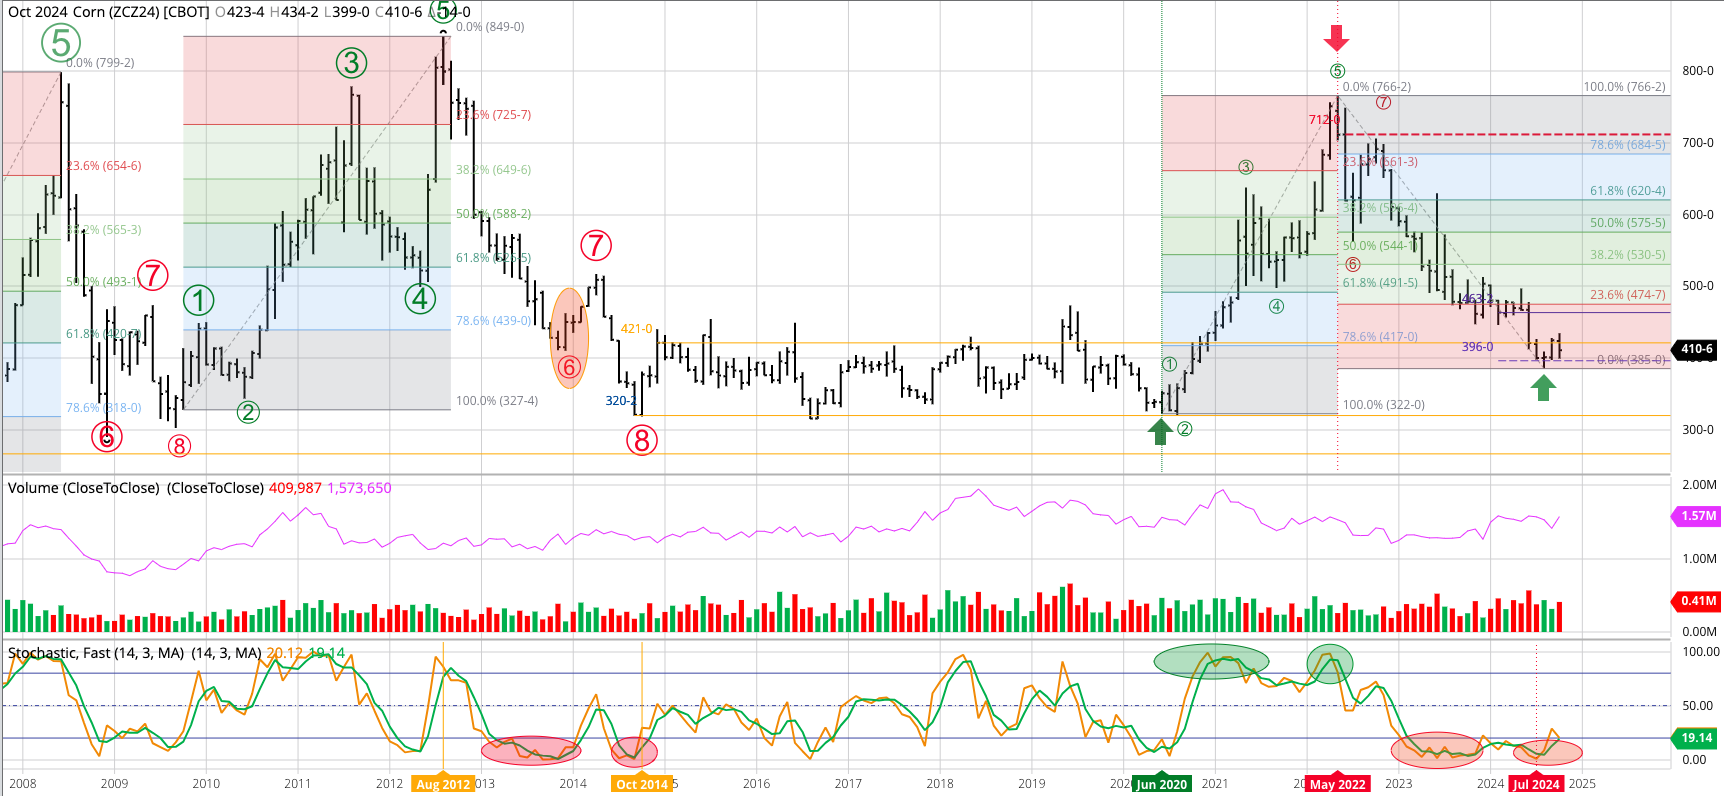


December Corn: Dec24 extended its major uptrend to a high of $4.3425 during October before closing at $4.1075, down 14 cents for the month.
Theoretical Positions:
- Hedgers:
- See Weekly Analysis: Grains (both Futures and Cash)
- Traders:
- Short Dec24 futures positions could’ve been covered near the August close of $4.01.
- And long positions established at the same price
- These long positions could’ve been rolled to Dec25 at a carry of 25.5 cents on Monday, October 28
- Dec24 was at (roughly) $4.1325
- Dec25 was at (roughly) $4.3875 (new long position)
- Traders may have sold Dec24 $4.00 put options at 20.0 cents
- If so
- then these options would’ve been bought back at 2 2/8 cents (September 30)
- and long futures positions established in Dec24 on a stop at $4.2025
- creating a long futures position of $4.0250
- With these positions rolled to Dec25 on Monday, October 28 (see above)
- If so
- Short Dec24 futures positions could’ve been covered near the August close of $4.01.
Corn Cash Index: The National Corn Index (NCI, national average cash price) still has not competed a bullish reversal on its monthly chart. Theoretical Positions: End users could’ve extend their coverage based on the NCI’s secondary (intermediate-term) uptrend and the major uptrend in futures.
Teucrium Corn Fund (CORN) extended its major uptrend to a high of $18.85 during October before closing at $17.89, down $0.60 for the month. The upside target area is between $22.09 and $25.23. Theoretical Positions: CORN could’ve been bought near the August settlement of $17.70 with a stop below the August low of $17.02.


