


Side Note: For the record, I’m in agreement with Warren Buffett’s thoughts on technical analysis, at least in the Energies sector. Buffett has said on the subject, “I realized that technical analysis didn’t work when I turned the chart upside down and didn’t get a different answer.” To emphasize this point, the market making the most sense, from a technical point of view, is Natural Gas (aka the Widow Maker). That tells us all we need to know.
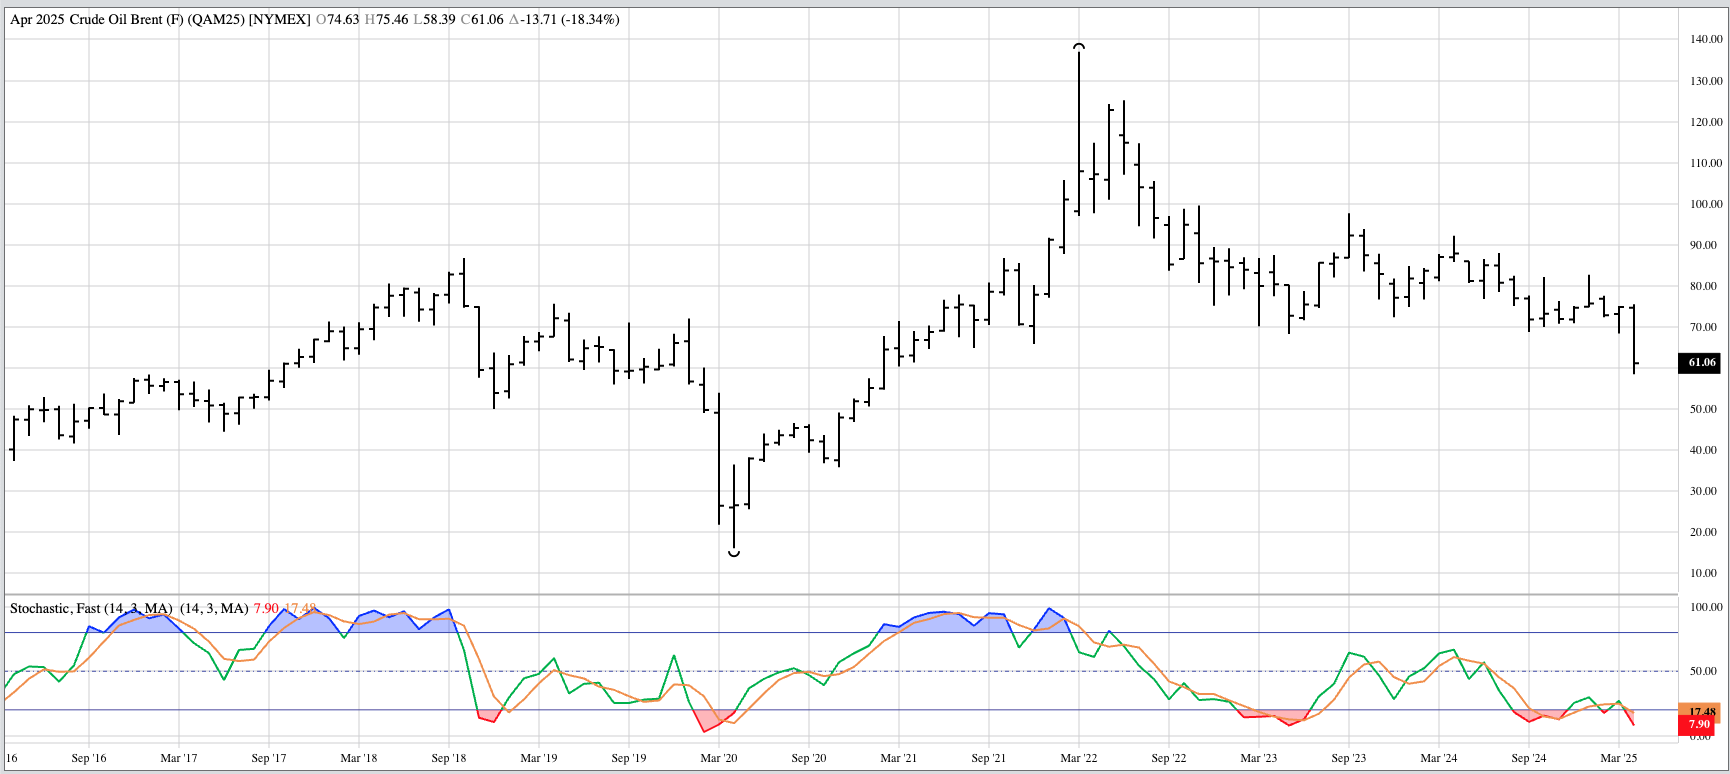
Brent crude (QA) moved back into a major (long-term) downtrend during April as it fell to a low of $58.39, its lowest price since February 2021. Theoretical Positions: If long-term investors went long near the March close of $74.74, then sell stops below the March low of $68.34 would’ve been hit, resulting in a loss of $6.40 (0.9%).
WTI crude oil (CL) moved back into a major downtrend as it fell to a low of $55.12, its lowest price since February 2021. Theoretical Positions: Long-term investors are likely on the sidelines for now given the WTI forward curve remains in backwardation.
Distillates (HO, heating oil, diesel fuel, jet fuel, etc.): The market reversed course once again, falling back to a major downtrend as the spot-month contract took out its previous low of $2.0431 from September 2024. The contract hit a low of $1.9373 during April, its lowest price since August 2021. Theoretical Positions: If traders bought on the bullish breakout above $2.4183, sell stops below the previous low of $2.0431 would’ve been triggered during April creating a loss of 37.52 cents (15.5%).
RBOB gasoline (RB): I don’t know what to call the major trend as April came to an end. After a series of new 4-month highs the spot-month contract completed a bearish outside month, closing at $2.0177, down 27.3 cents (11.9%) from its March settlement. Theoretical Positions: Traders might’ve bought on the new 4-month high near $2.1753 during February. If so, sell stops below the previous 4-month low of $1.8949 would’ve been triggered creating a loss of 28.0 cents (12.9%).
Natural gas (NG) remains in a major uptrend. The selloff during April looks to be Wave 4 of a 5-wave pattern. Theoretical Positions: Traders might’ve gone long on the bullish breakout above $2.168 during May 2024. Additional long positions may have been established above the May high of $2.924 during June. Additional longs may have been added near the August close of $2.127 based on the spot-month contract completing a bullish spike reversal, indicating a Wave 2 low. Another set of long positions might’ve been added during February as the spot-month contract took auto the January high of $4.369. If so, then the average long position would be roughly $2.897.
The Bottom Line: I do not like the Energies sector at this time.


