
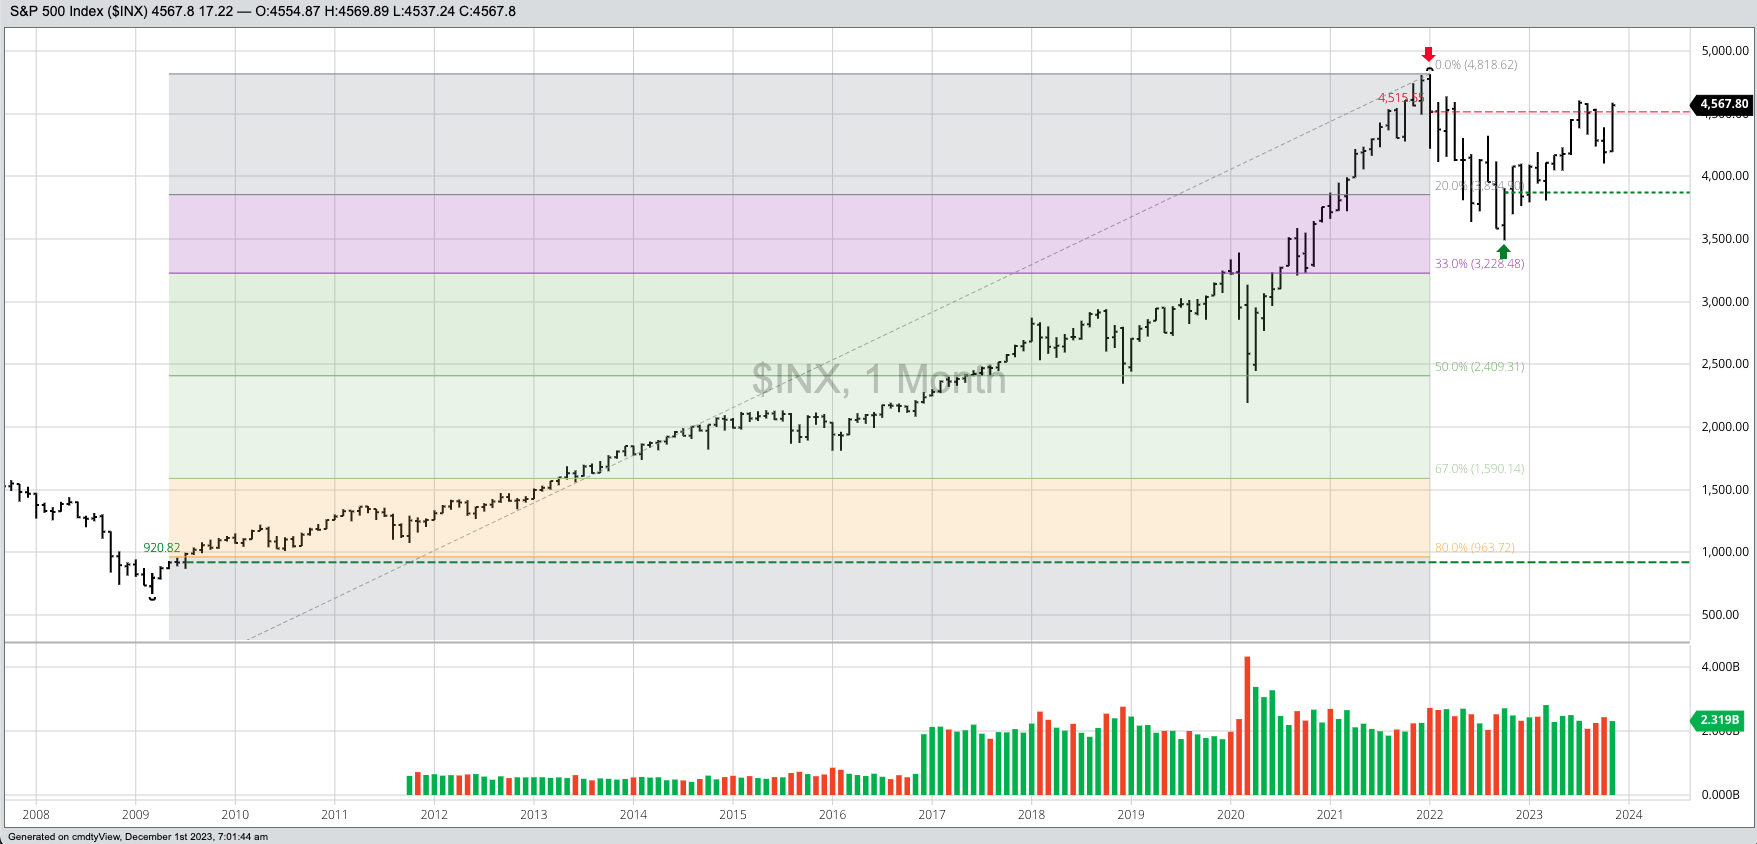


The S&P 500 ($INX) remains in a major (long-term) 5-wave uptrend, with the 3-month selloff through late October looking to be a down wave (Wave 2 or 4) in the major pattern. If this is true, then the $INX would be expected to take out its previous high of 4,607.07 (July 2023) over the coming months. The $INX posted a high of 4,587.64 during November before closing at 4,567.80. Theoretical Positions: Long from the October 2022 close of 3,871.98 with a stop below the October 2023 low of 4,103.78.
The Dow Jones Industrial Average ($DOWI) remains in a major 5-wave uptrend. The $DOWI posted a new 2023 high of 35,970,70 near the end of November before finishing the month at 35,950.89. Theoretical Positions: Long from at least the October 2022 settlement of 32,732.95 if not the breakout of the September high at 32,504.04. Possible stops would be placed below the 4-month low of 33,306.30 from October 2023.
The Nasdaq ($NASX) remains in a major uptrend. Similar to the S&P 500, the $NASX challenged its 2023 high of 14,446.55 in late November as it hit 14,423.22 before closing at 14,226.22. Theoretical Positions: Long from the October 2022 close of 10,988.15 with a possible stop below the October 2023 low of 12,543.86.
The US 10-year T-note (ZN) looks to have rolled into a new major uptrend, completing a bullish 2-month reversal during November. However, this is not one of the most reliable reversal patterns, often leading to a quick retracement of the initial move. Heading into ?December support is at the October low of 105-105 with resistance at the previous 4-month high of 111-290 from August. Theoretical Positions: New longs might’ve been established near the November 2023 close of 109-150. Others may be waiting for a retracement. Either way, sell stops would be placed below the October 2023 low of 105-105.
Gold (Cash Index): Gold (Cash Index): The cash index looked to be in a major sideways pattern after completing a series of conflicting technical patterns since August 2020. The latest was a bullish outside month during October that indicated buyers could push the market back toward the August 2020 high of $2,070.48. A side note: The index hit a new all-time high of $2,073.11 on December 1. Theoretical Positions: It’s possible investment traders bought near the October 2023 close of $1,983.91 as previous short positions were stopped out.


