
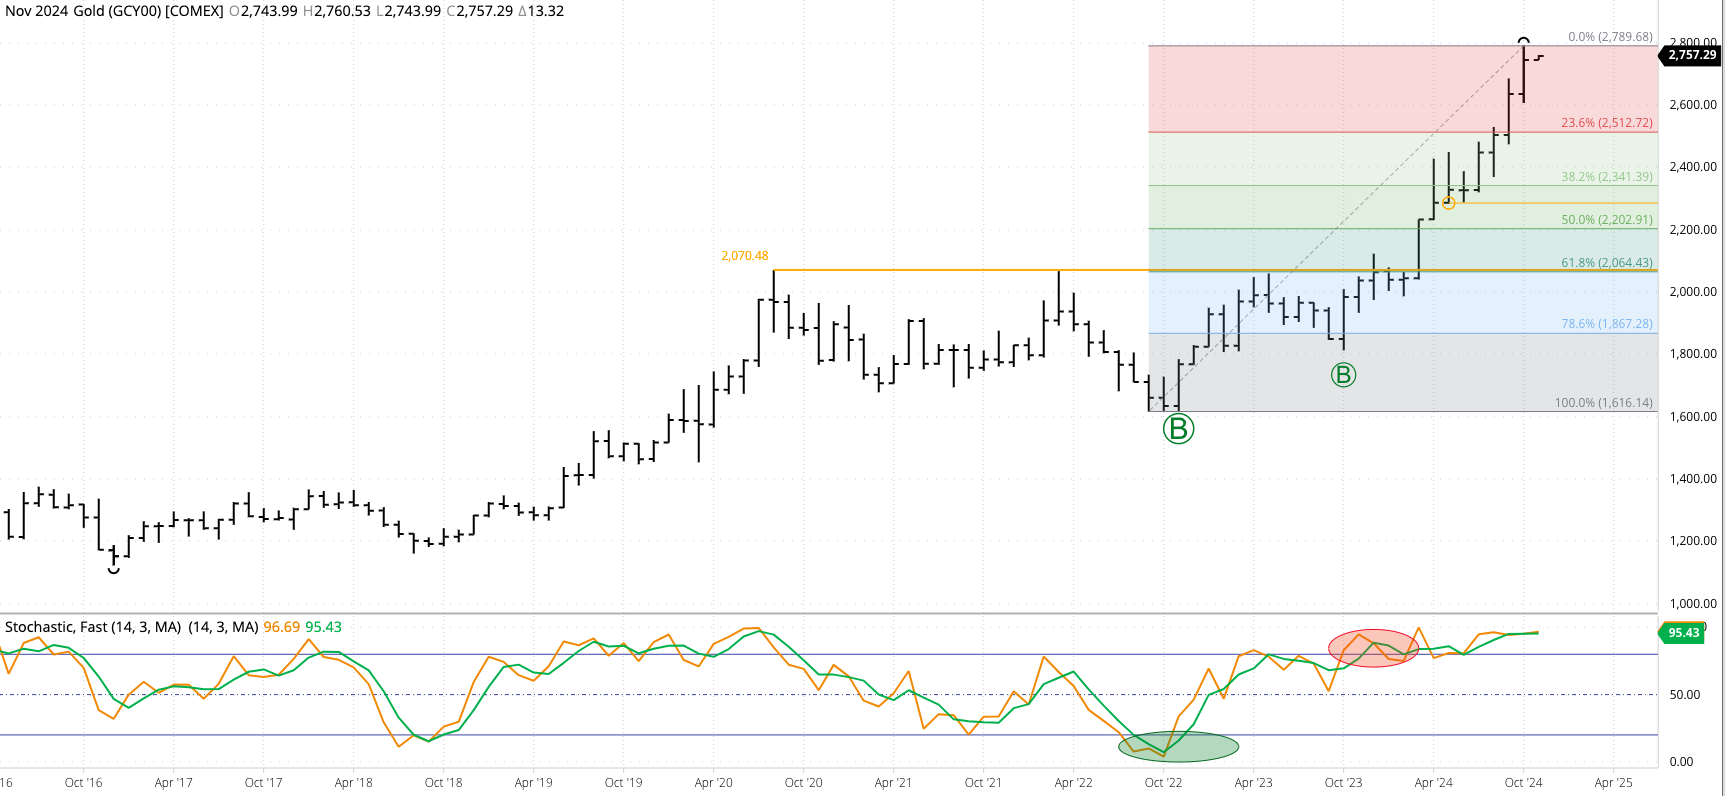


Gold (Cash Index): The cash index (GCY00) extended its major (long-term) uptrend to a high of $2,789.68 during October before closing at $2,743.97, up $109.27 for the month. Monthly stochastics remain above the overbought level of 80%. Theoretical Positions: It’s possible investment traders bought near the October 2023 close of $1,983.91 as previous short positions were stopped out. Sell stops would be placed below the previous 4-month low of $2,319.98 (July 2024).
Silver (Cash Index): The cash index (SIY00) extended its major (long-term) uptrend to a high of $34.7506 during October before closing at $32.6632, up $1.5010 for the month. Theoretical Positions: Traders might’ve gone long as a new 4-month high ($25.7691) was posted during April. Based on the possible bearish 2-month reversal during May and June, traders might’ve liquidated longs near the June close of $29.1418 for a gain of roughly $3.3727. If still holding longs, the previous 4-month low is down at $26.5293 (August 2024).
Copper (Cash Index): The index closed October at $4.3165, down $0.1830 for the month. I don’t know what to make of the long-term monthly chart, so would stay on the sidelines for now. Theoretical Positions: It’s possible investment traders bought as the new 4-month high was posted during December, and again as the contract took out its 4-month high of $3.9410 during March. Additional longs may have been added during April as the index hit another new 4-month high beyond $4.1195. If so, the average position would’ve been near $3.9850. It’s then possible traders liquidated longs at May’s close of $4.6150, expecting a continued selloff during June. It’s possible traders are staying on the sidelines.


