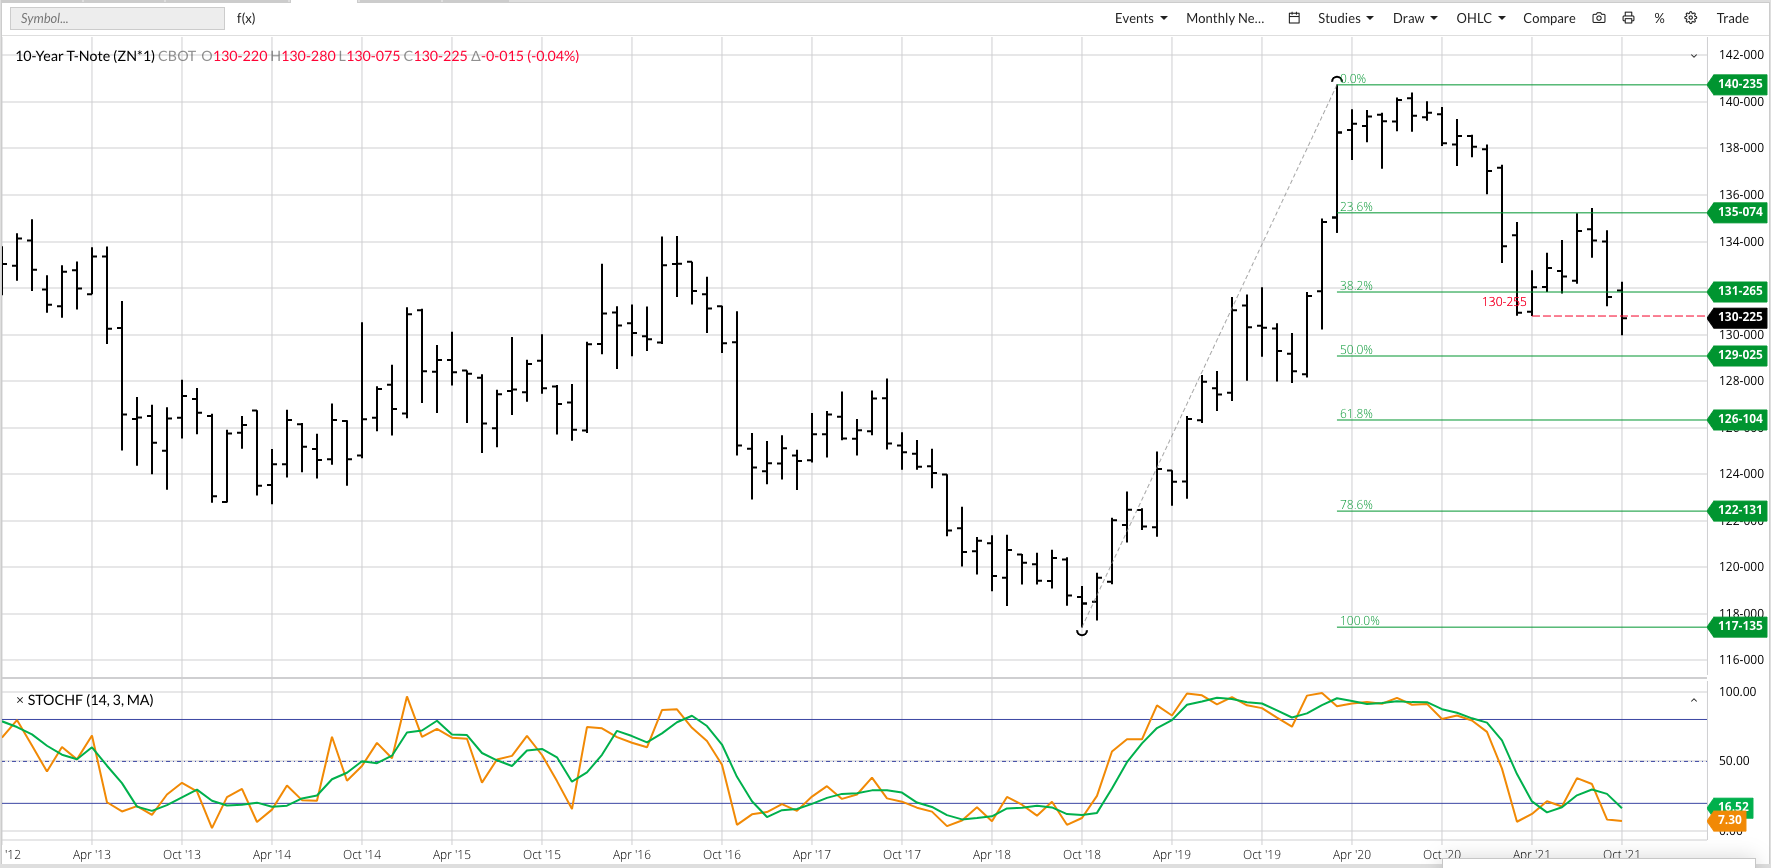
A look at the continuous monthly chart for the US Treasury 10-year T-note (ZN) shows it has completed its major (long-term) 3-wave downtrend as October saw it take out the Wave A (first wave) low of 130-255 (April 2021). Despite this, I’m still looking for the ZN to move lower with its next downside target 129-025, the 50% retracement level of the previous major uptrend from 117-135 (October 2018) through the high of 140-235 (March 2020). A few more months trending lower should be enough to pull monthly stochastics below the oversold level of 20% and set the stage for a bullish crossover that would signal an eventual change to a major uptrend.
What does an extended downtrend for the ZN mean in the big picture?
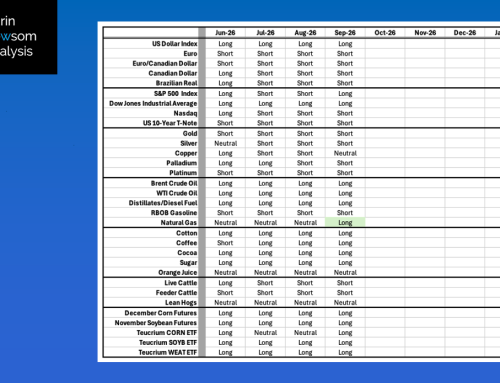
- Treasury yields should continue to rally
- Providing support to the US dollar index, possibly helping it extend its major uptrend
- and pressure the euro and Canadian dollar, both in major downtrends.
- This would also be viewed as bearish for the commodities complex in general