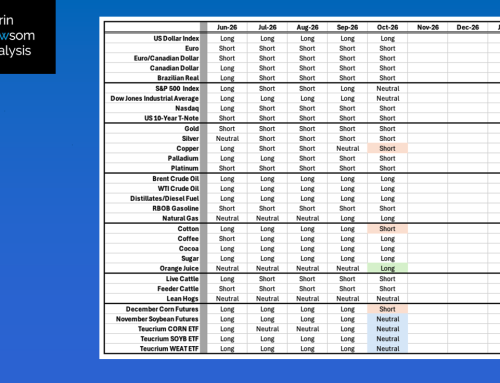
August was a busy month for the Newsom Capital Corn Fund. This fund is based on a couple different tools: December corn futures only and Exchanged Traded Funds (ETFs), the latter focusing on Teucrium’s CORN fund. While I covered these in Monthly Analysis, I want to go into more detail as we look ahead at September, the end of Q3 for the financial and calendar year. Why do I have a fund dedicated solely to the corn market? It goes back to what legendary investor Peter Lynch used to say, trade what you know. The last number of decades I have tracked, talked, and written more about corn than any other market. I like how it follows both its technical patterns and real fundamental reads.
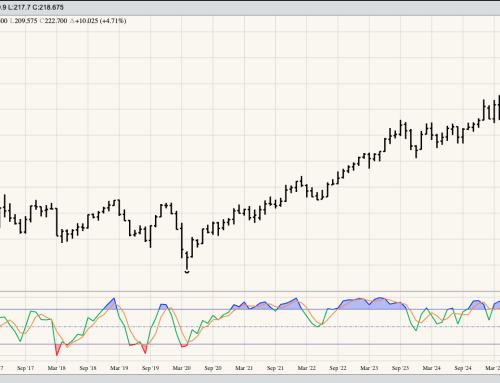
I’ll start with a brief discussion of Teucrium CORN. It has been an interesting ride since the fund first when long CORN at the end of August 2024. That month saw the ETF complete a bullish spike reversal on its long-term monthly chart before settling at $17.70, up $0.04 for the month. Another by was generated a year later, as August 2025 came to an end with another bullish spike reversal and a monthly settlement of $17.57. Theoretically, this put the long position at an average of $17.64 (roughly). Has there been months when the position may have been stopped out? Yes, from a technical point of view, most notably at the end of June 2026 when CORN finished at $16.75, down $1.18 for the month and its lowest monthly close since December 2020. But for those who held on, based on bullish leaning deferred futures spreads (at the time), CORN rallied to a high during August 2026 of $20.09 before closing at $20.06. CORN is up 13.1% for the calendar year.
Something that jumps out at me on CORN’s monthly chart is the explosion in volume. At the end of February, the chart shows roughly 72,000 shares. By the end of March that figure had jumped to 1.365 million shares, the largest in the ETFs’ history. As August 2026 nears its end, volume was near 430,000 shares.
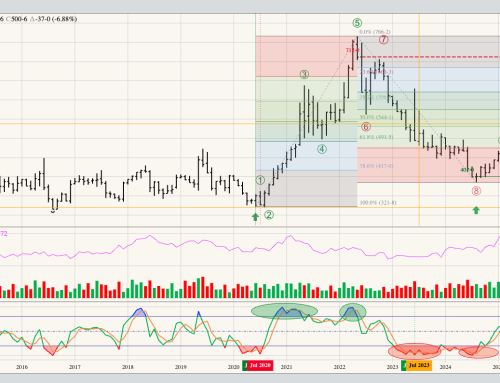
Like me, most of you are more interested in the futures market, where the fund is set up to use December contracts only. Here we see a cleaner long-term trend on the continuous monthly chart. The August 2024 low of $3.85 (Dec24 futures contract) was followed by a monthly close of $4.01, completing a bullish spike reversal marking the end of the previous long-term 3-wave downtrend that began with a bearish spike reversal at the May 2022 settlement and beginning of a new 5-wave uptrend.
- Wave 1 peaked during February 2025, leading to a…
- Wave 2 low of $3.92 during August 2025. This month saw another bullish spike reversal as the Dec25 contract closed at $4.2025. This was followed by a…
- Wave 3 high of $5.0650 during May 2026 and a…
- Wave 4 low of $4.2575 during June 2026
The August 2026 rally confirmed a Wave 5 uptrend as Dec26 took out the Wave 3 high on its way to a monthly mark of $5.42 and close of $5.38. Along the way, the Dec24 long was rolled to Dec25, with the addition that month then rolled to Dec26, and ultimately Dec27 this past month. Based on activity in futures positions alone, the fund would now be long Dec27 at approximately $5.17. However, there have also been a few options positions along the way, lowering the long Dec27 futures position to roughly $5.01 (see Monthly Analysis for details).
Am I still bullish? Yes. December corn could be considered a Type 9 market, the most bullish type, meaning both noncommercial and commercial traders are bullish. To begin with, the latest weekly run of our in-house algorithm showed “Long/Reduce” meaning it will be looking for an opportunity to take profits on some positions due to high volatility and technical indicators showing Dec26 corn to be overbought. Also, the latest Commitments of Traders report showed noncommercial traders held a net-long futures position of 440,915 contracts, an increase of 138,773 contracts as of Tuesday, August 25.
- This was the largest net-long futures position since 441,161 contracts the week of February 25, 2025
- and included an increase in long futures of 83,217 contracts
- Putting long futures at 593,012 contracts, the largest since 601,877 contracts on May 5, 2026
- and a decrease in short futures by 55,556 contracts
- Putting short futures at 152,097, the smallest since 129,986 on March 24, 2026
- The ratio of long futures to short futures is 3.9:1, roughly the same as the 3.95:1 as February 2025 when funds moved from a net-long to net-short futures position by mid-May.
- However, longer-term fundamentals are more bullish this year
Speaking of real fundamentals, the Dec-March futures spread closed Friday, August 28 covering a neutral 48% calculated full commercial carry. As we head into September and beyond, I’m expecting the carry in the Dec26-Mar27 futures spread to strengthen due to increased harvest pressure. My thought is more corn could be sold at harvest due to the high price created by this summer’s contra-seasonal rally. Meanwhile the May-July covered only 2% and was in position to move to an inverse this week telling us the longer-term commercial view is growing increasingly bullish. Further out, the Dec27-March28 futures spread closed covering a bullish 30% as compared to the Dec26-Mar27 spread finishing last August covering a neutral 40%. This tells us the long-term commercial outlook is more bullish than it was a year ago and could support the Dec27 contract.
Another spread we’ll be keeping an eye on is the 2027 edition of the November Soybean/December Corn, to gain an idea of what the 2027 planting season could bring. Heading into September the spread was at 2.36, as compared to the previous 10-year average weekly close of 2.39 meaning that prices could be favoring more planted US corn acres next spring. However, the 2026 average turned out to be 2.36, and according to USDA US producers still planted more soybean acres.
The bottom line is I like December corn from a fundamental and technical point of view. Regarding the latter, with monthly stochastics still not above the overbought level of 80% at month’s end, the Dec26 (and Dec27) contract still looks to have room to move higher. The next Fibonacci retracement level, the 50% mark, is near $4.7650. If Dec26 makes it that high by expiration, then it would likely be enough to pull monthly stochastics above 80% and set the stage for a possible bearish crossover signaling an eventual move to a long-term downtrend. If so, it would likely be due to the idea Dec27 is buying acres away from Nov27 soybeans.
Darin Newsom