What stood out to me at the end of September?
- Grains
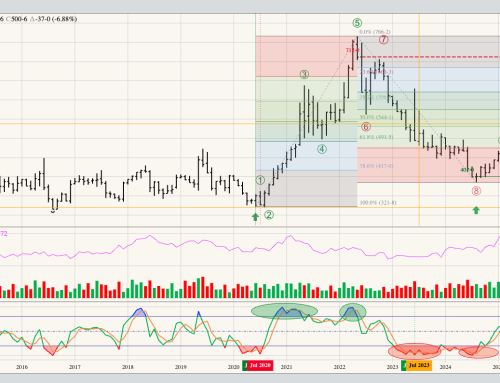
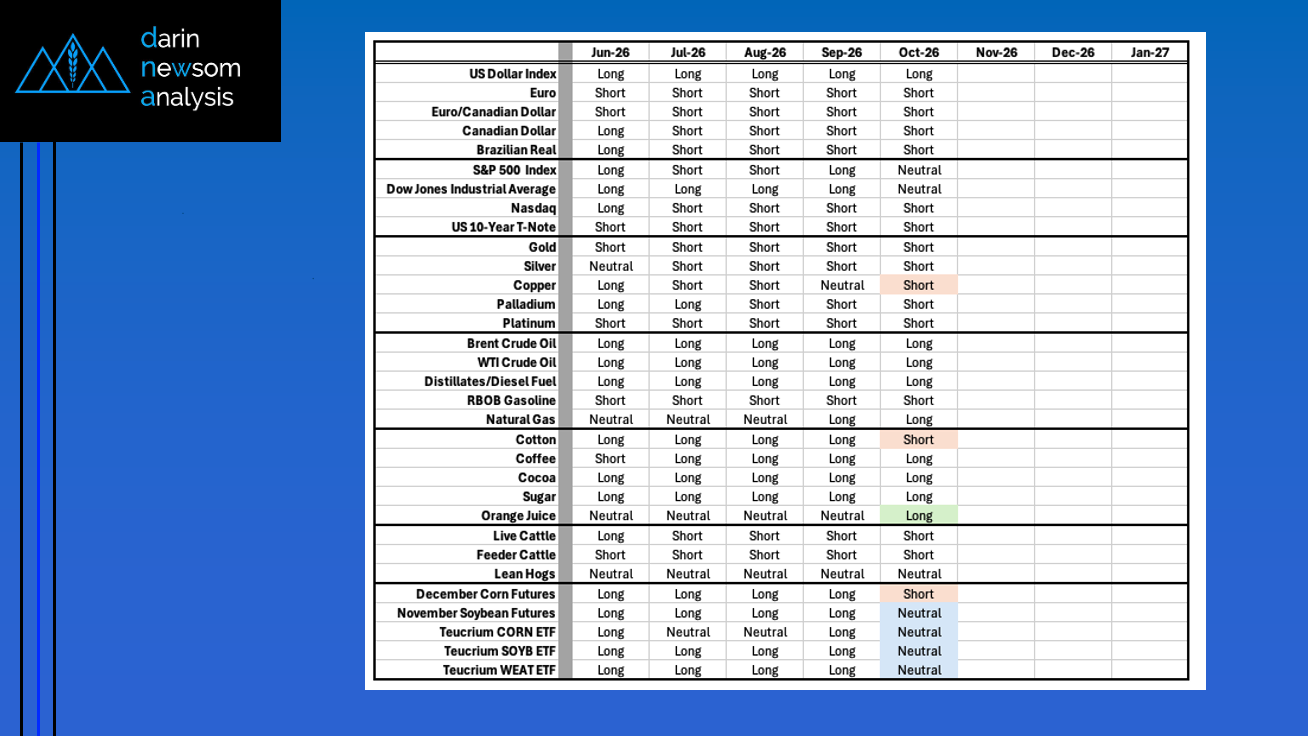
- Most of the long-term monthly charts showed bearish reversals during September, despite the fact reads on real fundamentals didn’t change all that much.
- Still, based on the first premise of Technical Analysis – Market action discounts everything – my decision was to go with what the long-term charts were showing us.
- While conceding the idea the charts could’ve been unduly influenced by activity the last day of September thanks to USDA’s quarterly Grain Stocks Keno game.
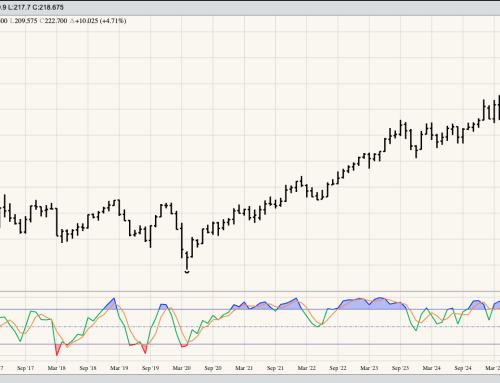
- Copper
- The economic indicator completed a bearish key reversal on its long-term monthly chart.
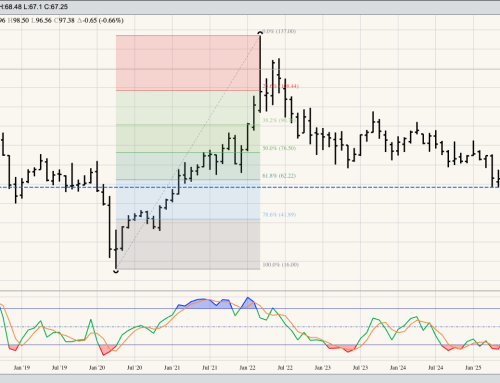
- Treasury futures
- The 10-year note hit its lowest level since June 2007 while
- the 30-year bond hit is lowest level since July 2002