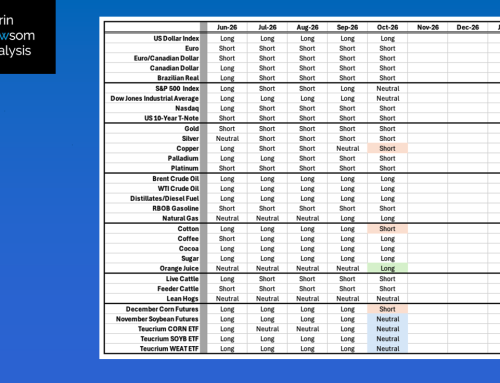
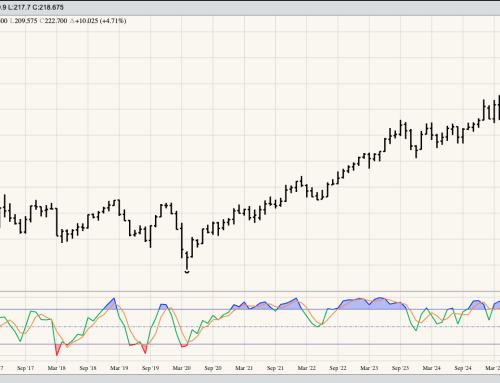
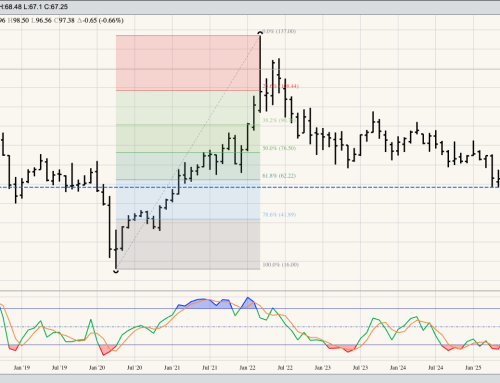
Note: The Grains sector is difficult at the end of September. From a technical point of view, I see long-term reversal patters resulting in sell signals in nearly all markets. A couple questions come to mind: Can we believe classic reversal patterns and were the long-term monthly charts unduly influenced by fund activity the last day of the month. For now, I will apply the same technical analysis I have for decades, to keep things consistent.
December Corn: The Dec26 contract extended the major (long-term) uptrend to a high of $5.4975 during September before closing at $5.0075, down 37.0 cents (6.9%) for the month. This completed a bearish key reversal indicating Wave 5 of the previous major uptrend was in place and a new major downtrend has begun.
Theoretical Positions:
- Hedgers:
- See Weekly Analysis: Grains (both Futures and Cash)
- Sales of 2026, 2027, and 2028 expected can be made near the September settlement.
- Investors:
- Long Dec26 futures were rolled to Dec27 during August at an inverse of 5.0 cents
- Putting long Dec27 at approximately $5.17
- These positions would be sold at or above the September settlement of $5.1725
- New short Dec27 futures positions could be made at or above the September close based on the completion of a bearish spike reversal on the long-term monthly chart.
- Long Dec26 futures were rolled to Dec27 during August at an inverse of 5.0 cents
November Soybeans: Nov26 extended the market’s (Nov soybeans only) major uptrend to a high of $13.3525 before closing September at $12.83, up 5.0 cents for the month. Meanwhile, monthly stochastics remained above the overbought level of 80% and in position for a bearish crossover. While no clear reversal pattern/sell signal was competed, if we apply the Horseshoe Proximity (close is close enough) I could make the argument Nov26 completed a bearish spike reversal. Given the Nov26-Nov27 spread finished the month at an inverse of 33.0, the roll forward will likely complete a bearish long-term reversal. Theoretical Positions: Long-term investors are likely long Nov26 from the October 2025 bullish breakout (Nov26 closed at $11.o6). Knowing these positions will need to be liquidated or rolled, sell orders could be placed near the September settlement of $12.93.
Teucrium Corn Fund (CORN): The fund posted a high during September of $20.43 before settling at 19.04, down $1.02 (5.1%) for the month. Technically, this completed a bearish spike reversal confirming a move to a major downtrend.. Theoretical Positions: CORN could’ve been bought near the August 2024 settlement of $17.70. Some may have added longs, or initiated initial positions near the August 2025 settlement of $17.57 based on a bullish spike reversal. A new round of buys could’ve been made near the October settlement of $17.79. All these combined would put the average position near $17.75. These positions would be liquidated near the September settlement of $19.04.
The Teucrium Soybean Fund (SOYB) extended its major uptrend to a high of $28.19 during September before closing at $27.51, up $0.27 (1.0%) for the month. Theoretical Positions: Investors might’ve bought near the December 2024 settlement of $21.48. Some may have added long positions near the April 2025 settlement of $21.47. Additional longs could’ve been added near the October 2025 settlement, creating an average price of $22.13. With monthly stochastics above the overbought level of 80% and nearing a bearish crossover, investors will be keeping an eye out for confirmation of a bearish long-term reversal to exit longs.
The Teucrium Wheat Fund (WEAT) extended its major uptrend to a high of $28.41 before closing September at $24.57, down $3.24 (11.7%) for the month. This completed a bearish spike reversal confirming a move to a major downtrend. Theoretical Positions: Long-term investors could’ve bought WEAT near the January close of $20.97. If so, these positions would be liquidated near the September settlement of $24.57.