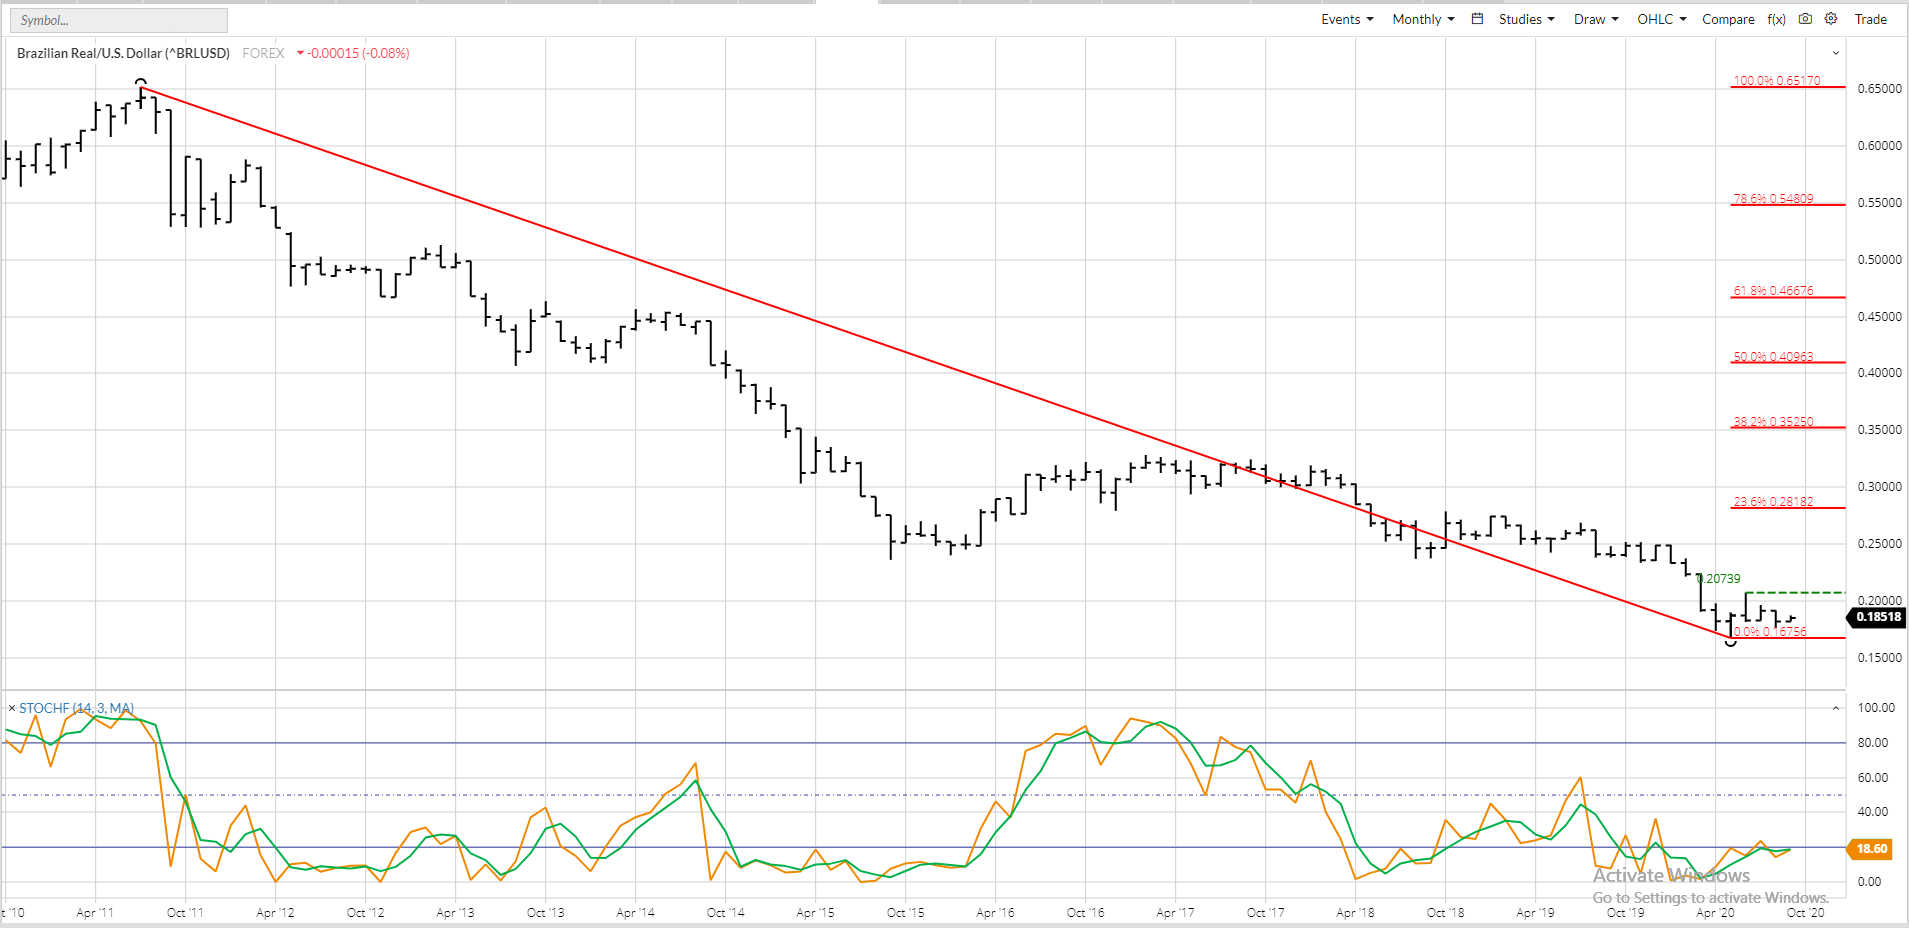
A look at the monthly chart for the Brazilian real (priced in US dollars, BRLUSD) shows the currency for the world’s largest soybean export is continuing to troll along the bottom of its recent major downtrend. Support is at the low of 0.16756 (May 2020) with resistance at the high of 0.20739 (June 2020). August saw the BRLUSD drop to a low of 0.17649 before stabilizing into the monthly close of 0.18199, still down 0.00944 for the month. Note, though, the most recent signal(s) by monthly stochastics has been a series of bullish crossovers below the oversold level of 20% with the most recent occurring at the end of April 2020. This indicates the real could eventually move into a major uptrend, meaning a breakout of the sideways channel it finds itself in and putting the initial upside target at 0.24722. This target is created by taking the width of the current channel (0.20739 – 0.16756 = 0.03983) and adding it to the bullish breakout mark of the June high. Again note there is a series of highs near this target price starting with September 2019 (0.24817) and running through January 2020 (0.24954). On the other hand, if for some reason the BRLUSD takes out the low end of its channel, the downside target would be 0.12773. This seems unlikely, unless helped along by a large entity possibly looking to keep global soybeans under pressure. Stay tuned.


