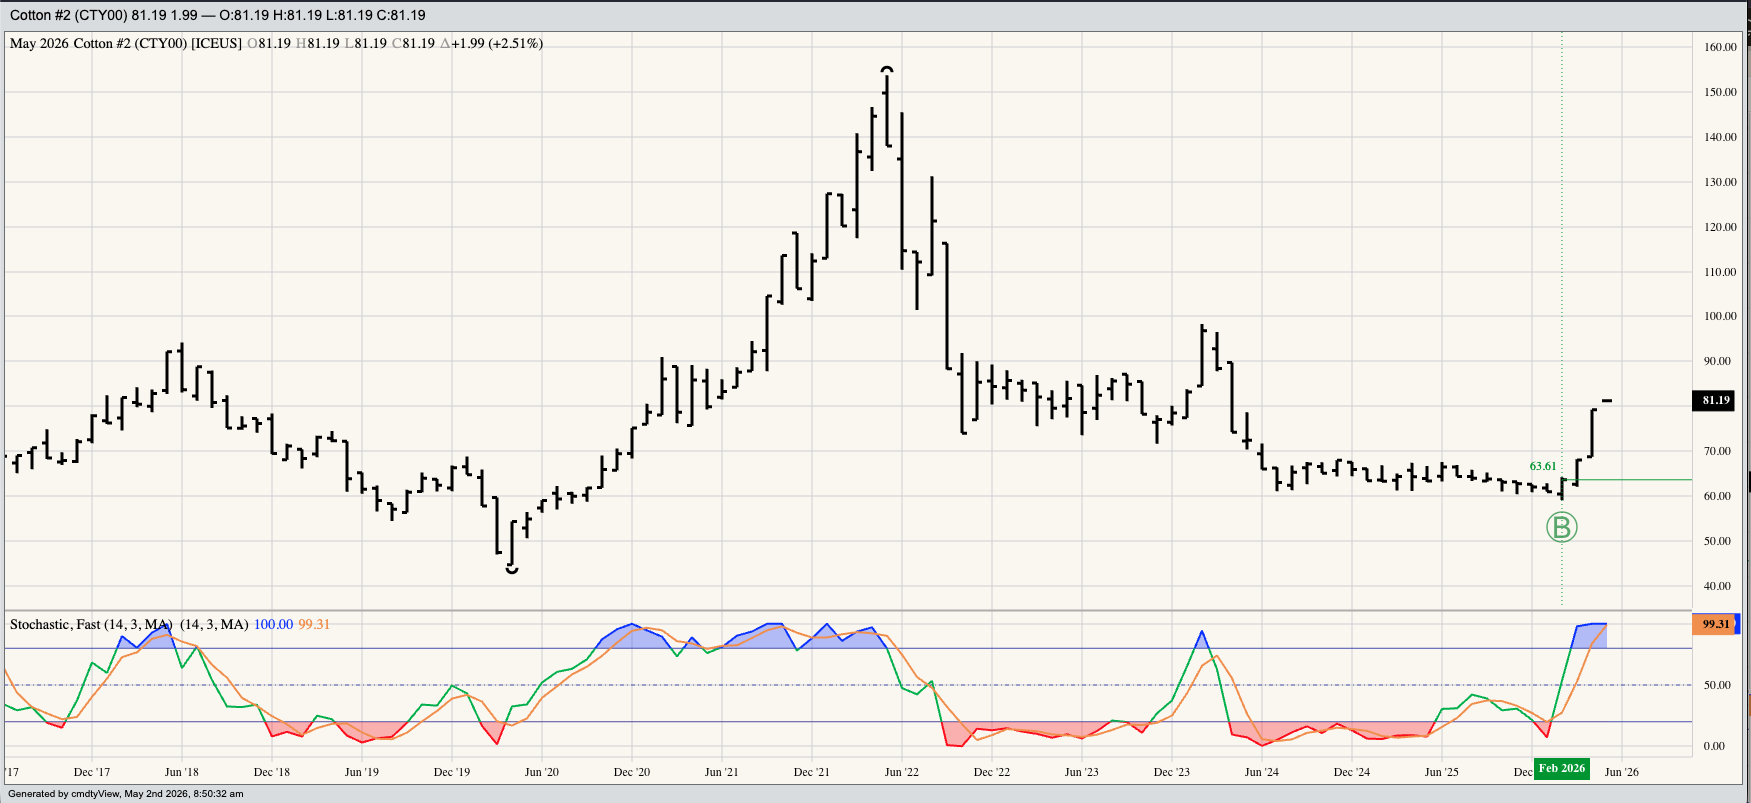


Cotton (CTY00, Cash Index): The Index completed a bullish key reversal during February meaning the major (long-term) trend turned up. The Index extended its major uptrend to a high of 79.20 during April before settling at at that mark, up 11.2 cents (16.5%) higher for the month. Theoretical Positions: Long-term investors could’ve bought (futures, ETFs) near the February settlement of 63.61 cents.
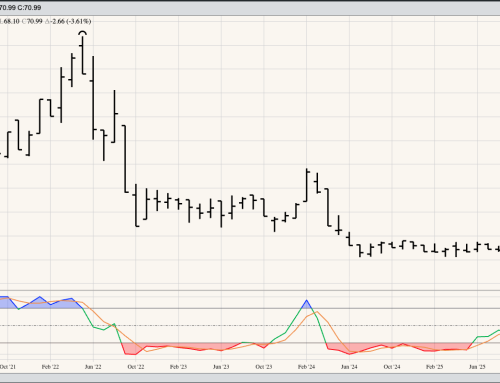
Coffee (KCY00, Cash Index): The Index looks to have moved to a major sideways trend, holding above the February low of 324.51 for another month. Monthly stochastics completed a bullish crossover below the oversold level of 20% at the end of April, indicating the major trend could soon turn up. Theoretical Positions: Long-term investors short the market from the September 2025 monthly settlement of 387.99 could look at covering those positions near the April close of 336.41. This would lock in a profit of roughly 51.55. New long positions could be established at the same price, though I do not see a clear buy signal at the end of April.
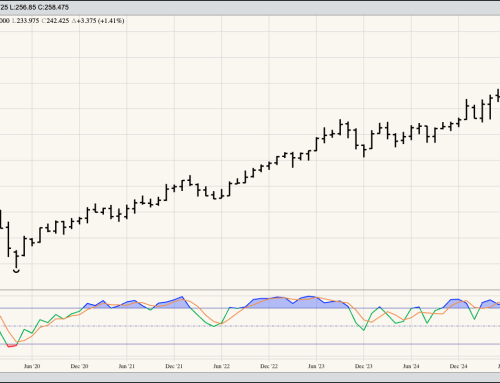
Cocoa (CCY00, Cash Index): The Index continued to consolidate during April, indicating the major downtrend may have come to an end with the February low monthly close of 2,798. Monthly stochasitcs completed a bullish crossover below the oversold level of 20% at the end of March. Theoretical Positions: Long-term investors who were short the market (futures, ETFs, etc.) may have covered these positions near the March settlement of 3,130. It’s possible some may have gone long at that same price, with sell stops below the February low.
Sugar (SBY00, Cash Index): The Index collapsed during April, creating a difficult read on its long-term monthly chart. At the end of March the Index looked to have moved into a major uptrend based on a key bullish reversal. However, the Index then fell to a new low of 13.42 during April before closing at 14.13, down 1.41 (9.1%) for the month. This was above the February settlement of 13.92. If we apply the Wilhelmi Element – the only price that matters is the close – the market could still be considered in a major uptrend. Theoretical Positions: Long-term investors could be long from near the March settlement of 15.54.
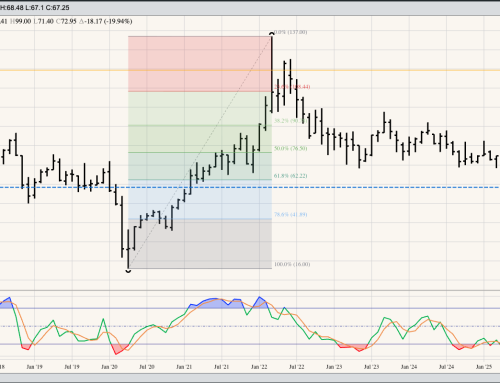
Orange Juice (OJY00, Cash Index): If the Index completed a bullish 2-month reversal at the end of December, and the January high of 240.00 was a Wave 1 peak, then the April low of 152.25 could be viewed as a Wave 2 low until proven otherwise. Given this, the Index would be expected to take out its Wave 1 high over the coming months. Theoretical Positions: Long-term investors may have covered previous short positions at the end of December. New longs could be established near the April close of 142.00 with sell stops below the November low of 137.55.