I’ve changed my monthly discussion of real month-end fundamentals for the various grain markets. I’m simplifying the conversation by applying the Law of Supply and Demand: Market Price is the point where the quantity demanded equals quantities available creating a market equilibrium. My take on this Law is tweaked by looking at “available supplies” rather than “total supplies”, an important distinction in the Grains sector given supplies can be held off the market in on-farm or commercial storage. If we consider the three variables in the equation (Price = Supply, Demand) the only one known is Market Price. Therefore, a study of Market Price is all that is needed to understand the relationship between the unknown variables of Supply and Demand. My monthly updates will look at the most recent end of month market price compared to last month, the previous quarter, and previous year. This tells us how supply and demand are changing in relation to each other even though we don’t/won’t/can’t know the actual numbers. As for the charts, I’ve inverted the price scale so the lower price is near the top and higher price at the low end of the scale. Therefore the shade area represents changes in available supplies in relation to demand. The lower the price, the more available supples. The higher the price, the tighter the available supplies are. Let me know your thoughts.
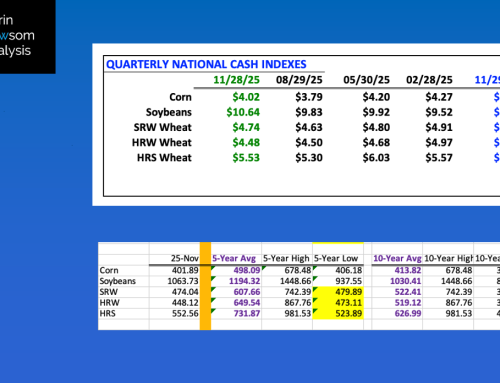
CORN (slide 2): The National Corn Index (NCI) was calculated near $4.43 at the end of December as compared to the end of November at $4.07 and the December 2023 price of $4.42. This tells us available supplies in relation to demand tightened during December 2024, but remain a bit larger than what was seen a year ago. The December 2024 closing calculation was the highest since the December 2023 figure, interestingly enough. It will be interesting to see what happens during January if some of 2024’s bushels held in on-farm storage are sold at the beginning of the new year.
SOYBEANS (slide 3): The National Soybean Index (NSI) was calculated near $9.50 at the end of December, as compared to the end of November at $9.38 and the December 2023 price of $12.42. This tells us available supplies in relation to demand tightened during December 2024, but remain much more cumbersome than what was seen a year ago. The spotlight now turns to what happens late in January with existing trade agreements broken by the announcement of new tariffs and trade wars.
SRW WHEAT (slide 4): The National SRW Wheat Index (SWI) was calculated near $4.93 at the end of December, as compared to the end of November at $4.80 and the December 2023 price of $5.63. This tells us available supplies in relation to demand tightened during December 2024, but remain more cumbersome than what was seen a year ago. Some attention will be paid to the strengthening US dollar index as we start the new year, though I don’t view this factor as fundamentally important as most others*.
HRW WHEAT: The National HRW Wheat Index (HWI) was calculated near $4.98 at the end of December, as compared to the end of November at $4.73 and the December 2023 price of $5.85. Similar to the SRW market, this tells us available supplies in relation to demand tightened during December 2024, but remain more cumbersome than what was seen a year ago. Attention will soon be turning toward the new-crop market with the July-September Kansas City futures spread covering a bearish 73% calculated full commercial carry as December 2024 came to an end.
HRS WHEAT (slide 5): The National HRS Wheat Index (HSI) was calculated near $5.76 at the end of December, as compared to the end of November at $5.66 and the December 2023 price of $6.94. Note the HSI was still nearly $1.20 below where it was a year ago indicating a more cumbersome year-to-year supply and demand situation. However, the HSI did post its highest month-end calculation since May 2024 indicating available supplies are tightening in relation to demand.
*You can read my Barchart piece on this subject here: (LINK)