As those of you who follow me on the social media site Twitter know, pie is one of my favorite food groups. And to borrow a line from a good friend and former business partner, who taught a much younger me the ropes of being a broker, “I have two favorite types of pie, hot and cold.” I’ll also add a side note here: I had a nice piece of cherry pie for breakfast (with some fresh ground coffee). Hard to beat that start to the U.S. Labor Day 3-day holiday weekend.
I can hear you out there, “Why all this talk of pie? I thought this was a technical analysis piece on cash soybeans?”
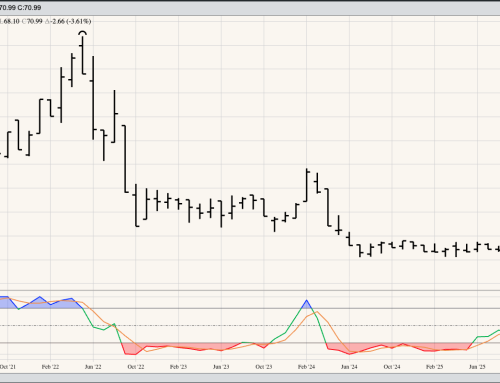
Well, one of the pies I am willing to eat is the occasional piece of Humble Pie. As you know, based on my recent column “Therapy Session” (August 15) and my Soybean Supply and Demand post (September 2), I struggle with Soybean Bipolar Disorder (SBD, and I realize I have to be sure and enunciate if I ever record that for Spoken Commentary). Based on monthly stochastic action March-April-May 2018 timeframe, when this momentum study crossed over just below the overbought level of 80% (left-hand red dashed oval) as the cmdty National Soybean Price Index (NSPI, weighted national average cash price) moved into a 3-wave downtrend, I applied the same technical reading to what occurred between November 2019 and January 2020. My reading of a new major downtrend was also seeming confirmed by a bearish 2-month reversal spanning December 2019 and January 2020, as clear a pattern as one could hope to see.
Initially the NSPI did fall, moving to $7.7224 during March 2020. However, that month saw the NSPI close a $8.4111, up $0.0113 for the month. As I go back and recount waves, this was now the bottom of Wave 4 rather than a Wave B bottom as part of a 3-wave downtrend.
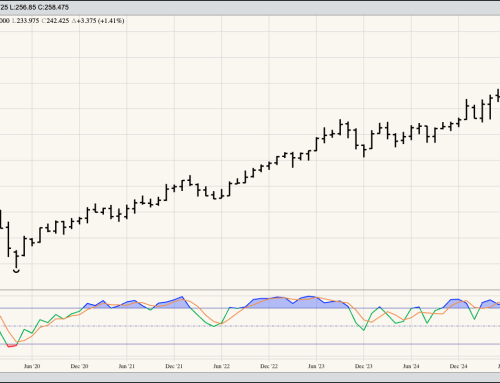
But then the NSPI had to go and complicate things with the new low of $7.6441 during April and the quiet consolidation seen in May, before renewing is upswing this past June. This 3-month period is a solid example of Newsom Rule #4A: A market that can’t go down, won’t go down. Recall at this time the cmdty National Soybean Basis Index (NCBI, weighted national average) was strong and the futures market’s forward curve was growing more bullish. It’s this fundamental support that triggered the move to a Wave 5 that extended the NSPI to a new major high of $9.1074 during August with continued buying seen early in September.
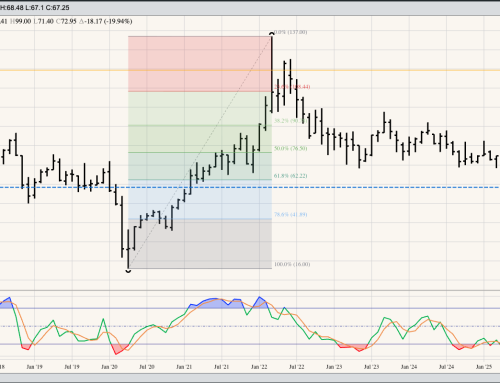
How high might the NSPI climb? There could be some resistance in the $9.35 to $9.41 range, though a test of the previous Wave 5 high near $9.98 isn’t out of the question. Keep in mind a few things, though:
- Monthly stochasitcs have now moved above the overbought level of 80% (right hand dashed red oval), in position for a potential bearish crossover that would signal a coming end of the major (long-term) uptrend)
- Peaks and valleys have been occurring every year dating back to the high posted during June 2016. This led to a June 2017 low, followed by a March 2018 high and May 2019 Wave C low. This pattern would suggest we should see a Wave 5 high in 2020.
- The 2020 harvest is just around the corner, and with no carry in the forward curve of the futures market, more cash soybeans could be sold at harvest.