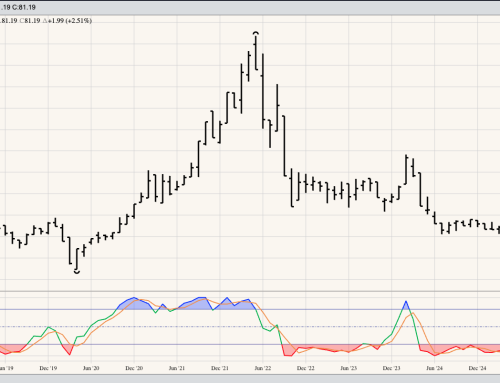
The first thing I thought of when I looked at this continuous monthly chart for crude oil (CL) was the line from Macbeth, “Screw your courage to the sticking place.” This is likely the rallying cry for technical analysts, like myself, that see a bearish 2-month reversal pattern indicating CL’s major (long-term) trend has turned down while its forward curve remains inverted. To sell a market in such a situation is to bet against a normal Rubber Band Disposition playing out, meaning rather than noncommercial traders moving to get in line with the commercial side one thinks the opposite will happen. It’s a bold move, one that does indeed require courage, in this case more so with the next OPEC+ meeting scheduled to begin Thursday, December 2.
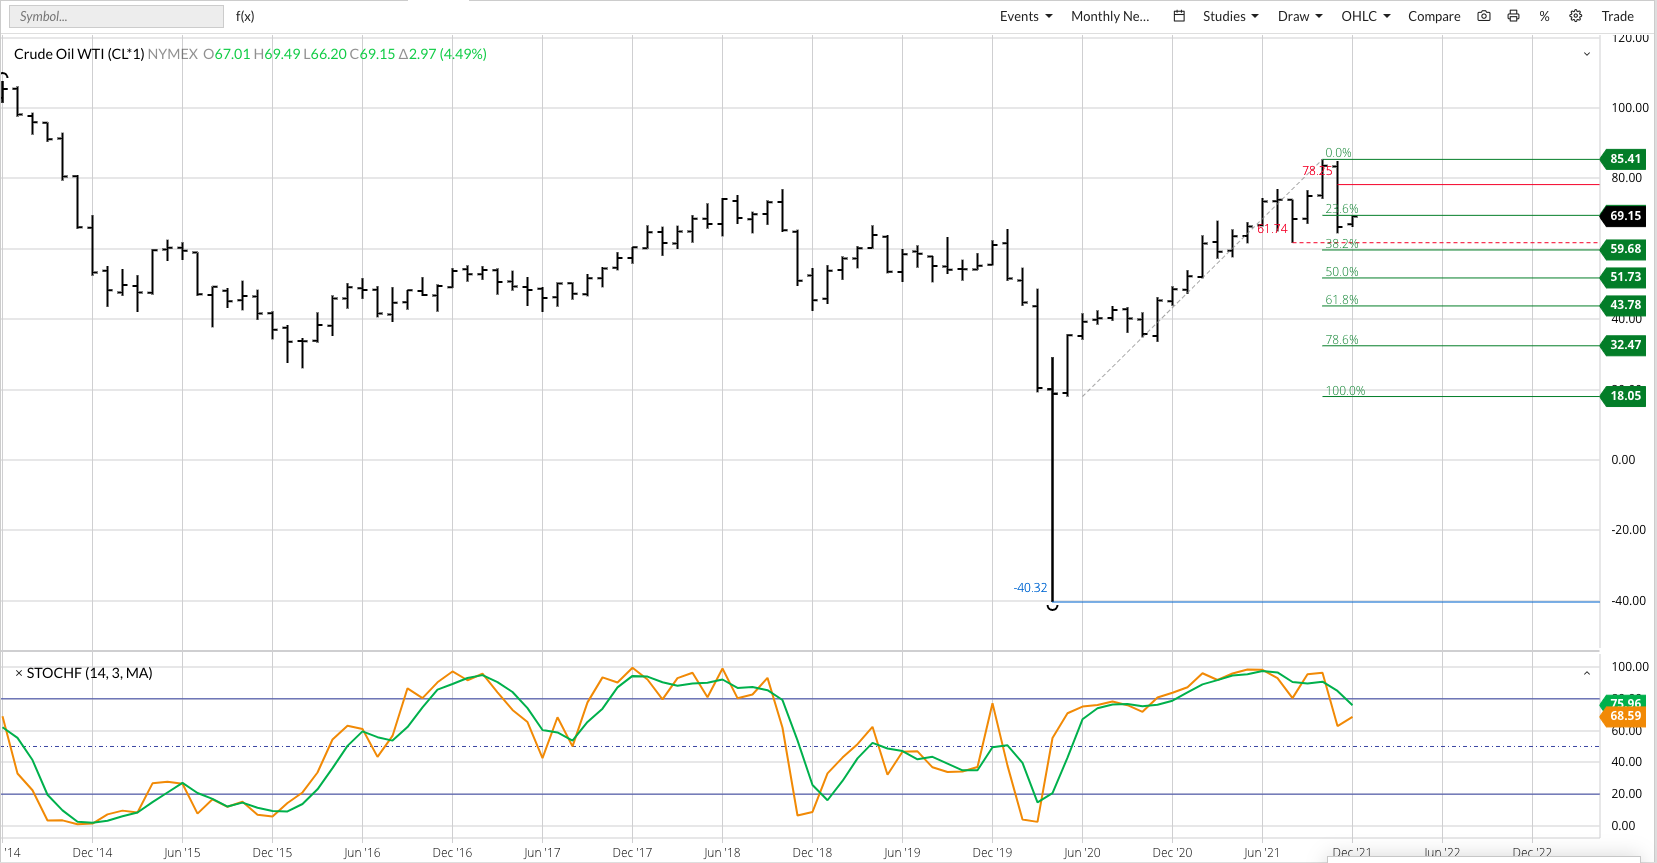
But this is technical analysis and the monthly chart says the major trend has turned. The bearish 2-month reversal completed at the end of November confirms the bearish crossover by monthly stochastics at the end of August, the signal the trend was set to change in the not-too-distant future. As has been the case for more than a year, it’s hard to say what the downside target area is given the move to negative numbers during April 2020. Since then I’ve used the May 2020 low of $18.05 as a starting point, viewing the April move as an outlier. Based on this and the continued bullish forward curve, the downside target area is between $59.68 and $51.73, the 38.2% and 50% retracement levels of the previous major uptrend through the high of $85.41 (October 2021).
Theoretical Position: If shorting CL based on long-term bearish technical signals and patterns, a buy stop could be placed above the October high. Long-term support is at the previous 4-month low of $61.74. The market’s continuous weekly chart still shows a secondary (intermediate-term) downtrend with the spot-month contract posting a new 4-week low of $64.43 Tuesday.