The bottom-line supply and demand number is stocks-to-use (s/u). I’ve long said stocks-to-use is the Readers’ Digest version of supply and demand, in that this one number can tell us the bullishness, bearishness, or neutrality of a market’s fundamentals. I’ve also argued endlessly over the years with economists, my point being there should be a strong positive correlation between stocks-to-use and cash price. Given this premise, I’ve developed my system between the two for all three major markets (wheat, corn, and soybeans) with the r-squared[I]for all three near 100%. Recently I’ve switched to the month end calculation of the DTN National Corn and Soybean Price Indexes based on a longer track record. I’m still working on getting the back data for wheat. By using the end of month number rather than it gives us a picture of the stocks-to-use situation at the end of each month, a system that should smooth out the wide changes seen at the end of a marketing year. This continues to be a work in progress, with the bottom line being stocks-to-use remain bullish for all three markets.
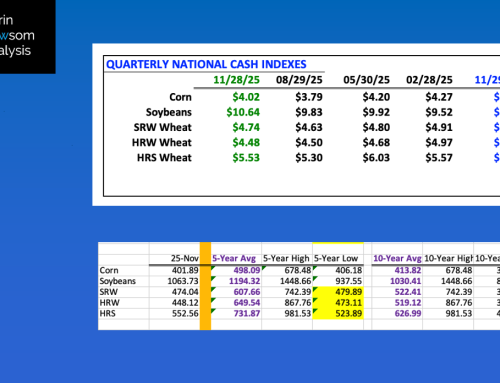
WHEAT: I’m still using the Barchart National Wheat Price Indexes (weighted national average cash prices). At the end of July the average wheat index price came in at $9.82, correlating to an available stocks-to-use calculation of 12.5%. This compares to the end of June $10.79 and 10%. What changed during July? The key fundamental factor was winter wheat harvest with the bulk of 2022 production brought in during the month. This also means increased cash sales weighed on both futures and basis, pushing cash prices lower. It’s interesting to note, though, that even accounting for this the available s/u only climbed to 12.5%, still an extremely low read for the US with the previous July reading coming in at $6.43 and 30%. We’ll see what happens during August as ships start to move grain out of Ukraine’s Black Sea port at Odesa.
CORN: The DTN National Corn Price Index (NCI, unweighted national average cash price) was calculated at $7.00 on July 31, 2022. This correlates to an end of month available stocks-to-use of 8.3% The end of June showed $7.17 and 8.0% with last July coming in at $6.21 and 9.3%. Has the 2021-2022 supply and demand situation loosened the last few months? Yes. Why? Remaining bushels were sold when cash corn reached $8.00 during April, and a long-term bearish reversal pattern was completed during May and June. Additionally, demand has slowed as we near the end of the marketing year, but has not been destroyed as some in the industry like to talk about. Basis remains strong, with last Friday’s national average calculation coming in at 82.6 cents over September and 78.9 cents over December. As for demand, the latest cattle on feed numbers (for July 1) still showed feed yards with more numbers than the previous year, US exports are on a pace for total shipments to reach 2.423 bb (down 8% from the previous marketing year), while ethanol demand could be seeing a seasonal slowdown. All that being said, the end of July available stocks-to-use calculation still has the 2021-2022 marketing year at its third tightest on record behind 2010-2011 (7.7%) and 2011-2012 (7.3%).
SOYBEANS: The DTN National Soybean Price Index (NsI, unweighted national average cash price) was calculated at $15.38 on July 31, 2022. This correlated to an available stocks-to-use calculation of 3.5%. The end of June had the NSI at $15.86 and 3.0% while the previous July saw the NSI come in at $13.79 and 5.2%. The US available stocks-to-use situation continues to loosen a bit due to a late marketing year slowdown in demand due to a lack of supplies. Despite the two month dip so far this summer, the 2021-2022 marketing year is on pace to finish as the second tightest situation on record, trailing only the 2011-2012 marketing year showing a final NSI price of $17.32 correlating to an available stocks-to-use calculation of 2.0%.
[i] R-squared is defined as “a statistical measure of fit that indicates how much variation of a dependent variable is explained by the independent variable in a regression model.” (Investopedia). In my world, it is how closely related two (or more) variables are, in this case national average cash price and stocks-to-use.