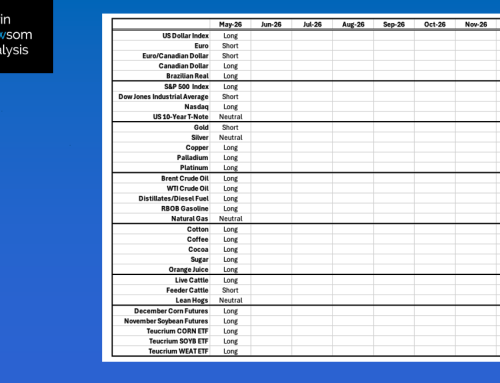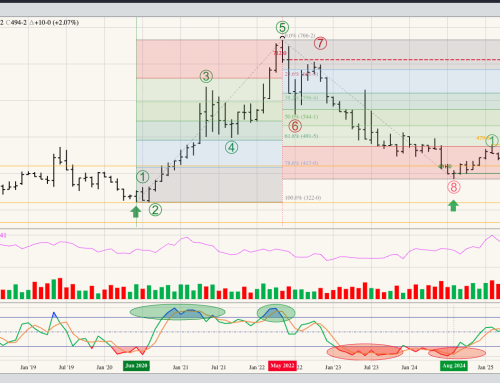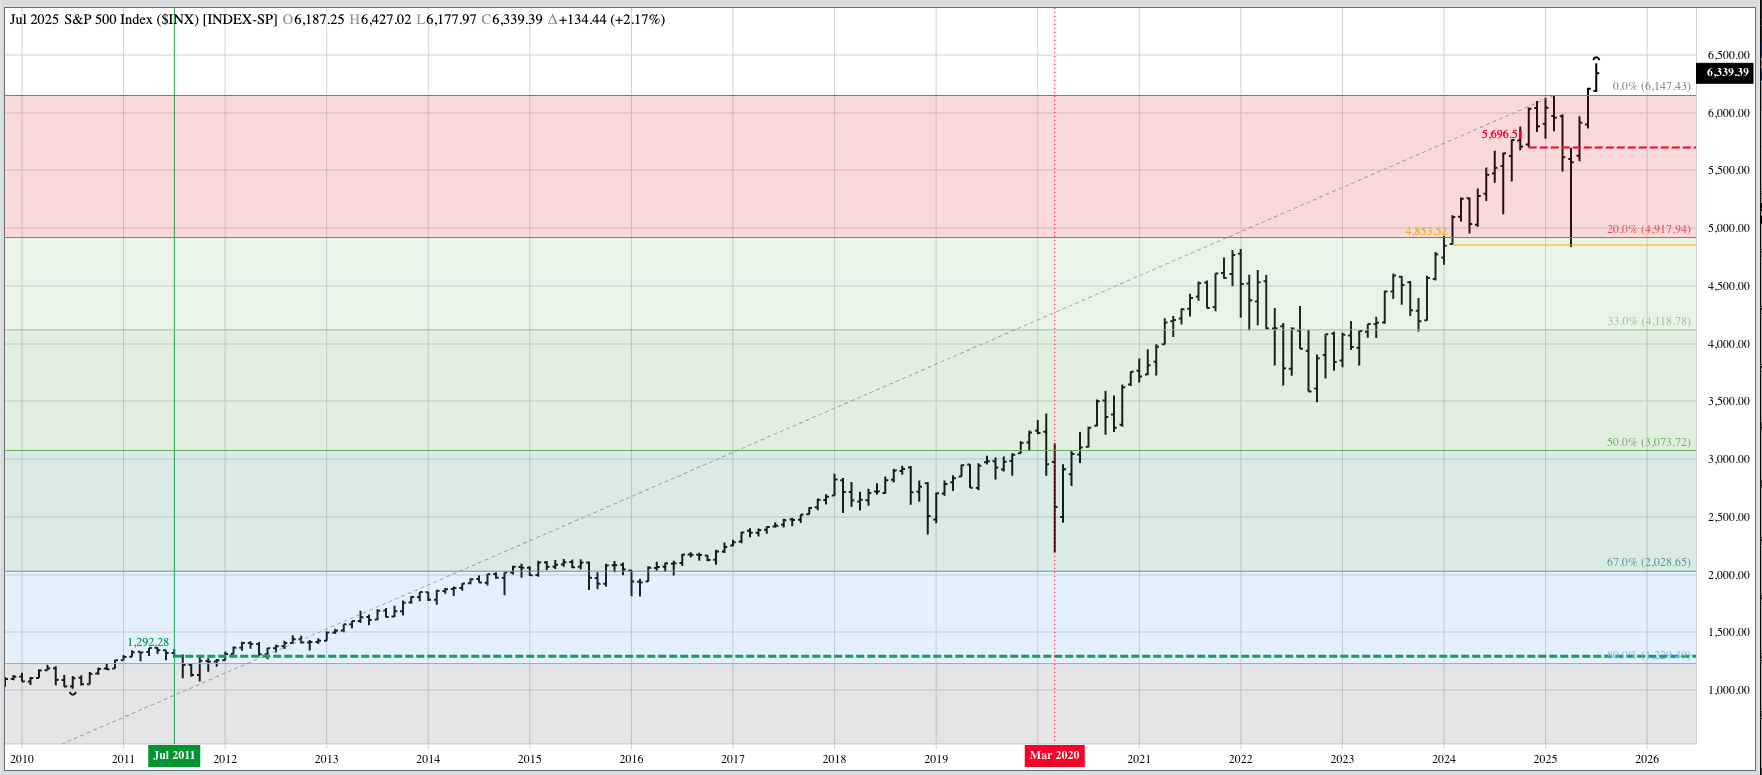


The S&P 500 ($INX): It could still be argued the S&P 500 remains in a major (long-term) downtrend that began with the bearish spike reversal completed during February 2025 and confirmed with a new 4-month low during March. That being said, the Index hit a new all-time high in both June and July, raising the question of if the previous bearish reversal was nullified. Based on classic technical analysis the answer is “no”. If we apply Elliott Wave Theory, and view the ongoing rally as a Wave B move, then by definition: Depending on the type of correction taking place, the rally may test the old highs (forming a double top) or EVEN EXCEED THE OLD HIGHS (emphasis mine) before turning back down. The July settlement of 6,399.39 was the third consecutive higher monthly close, bringing to mind a possible Benjamin Franklin Fish Analogy – if we believe the major trend is still down. Theoretical Positions: Long-term investors may have moved to cash given the uncertainty in the S&P 500.
The Dow Jones Industrial Average ($DOWI) remains in a major downtrend, technically, despite a third consecutive higher monthly settlement at the end of July. It could be argued this completed a Benjamin Franklin Fish Analogy (Like guests and fish, markets start to stink after three days/weeks/months (whatever time frame is being studied) of moving against the trend). Theoretical Positions: Long-term investors likely sold or protected their position as the DJIA confirmed a major downtrend during March 2025.
The Nasdaq ($NASX) completed a bullish spike reversal at the end of April before extending its rally to a new all-time high of 21,457.48 during July. Theoretical Positions: Long-term investors might’ve bought back into high-tech stocks late in April as the Index made its impressive run. Others likely stayed on the sidelines.
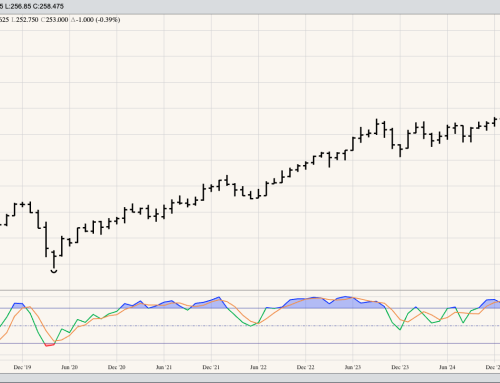
The US 10-year T-note (ZN): I’m going to continue to call the major trend sideways. If the US Fed is forced to raise interest rates to fight inflation tied to trade wars and tariffs, longer-term US Treasury instruments could come under increased pressure. Theoretical Positions: New longs might’ve been established near the November 2023 close of 109-150. Additional positions could’ve been established near the April 2024 close of 107-140. Another round of long positions could’ve been put in place during August 2024 as the ZN took out its Wave 1 high. Additional longs could be established near the November 2024 close, raising the overall position average to roughly 110-250. Investors could’ve added long positions on a move beyond the previous 4-month high of 111-155 (December) during March 2025. Sell stops would be below the April low of 109-080.