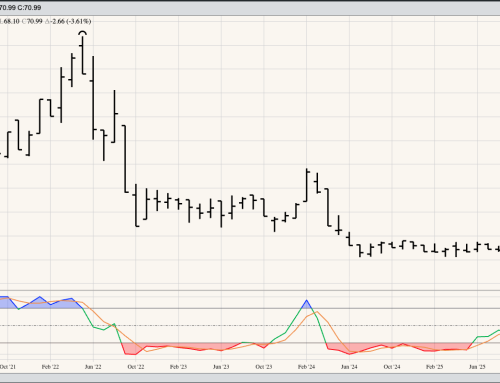
The US dollar index ($DXY) extended its major (long-term) uptrend to a high of 107.35 during October before abruptly falling in early November. The October high was a test of the 50% retracement level of the previous downtrend near 107.18, with the early November selloff looking to be Wave 2 of the major 5-wave uptrend pattern. If so, the initial downside target area is between 104.39 and 103.47. Theoretical Positions: Traders would’ve taken profits on short positions from near 112.12 (September 2022 close) as the $DXY hit a new 4-month high of roughly 104.72, a gain of about 7.40. New long positions would’ve been established at roughly the same price, roughly 104.70, with positions added as a new 2023 high was set near 105.90. This would create an average long of about 105.30, with a stop below the July 2023 low of 99.58.
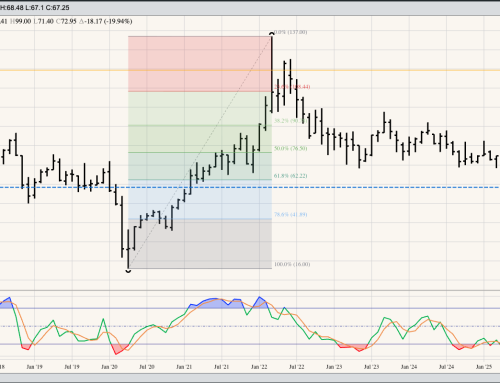
The euro (^EURUSD) extended its major 3-wave downtrend to a low of 1.04487 during October, a test of the downside target near 104.059. This price marks the 50% retracement level of the previous uptrend from 0.95364 (September 2022) through the high of 1.12754 (July 2023). The rally in early November looks to be Wave B (second wave) of the 3-wave pattern. Theoretical Positions: Traders would’ve been stopped out of previous long positions from 0.98024 (close of September 2022) just below the previous 4-month low of 1.06354 for a gain of 0.0833. New short positions would’ve been established at the same price, with stops above the July high of 1.1275.
The euro/Canadian dollar (^EURCAD) remains in a major downtrend after completing a bearish 2-month reversal at the end of May. The rally seen during July looks to be Wave B (second wave) of the 3-wave downtrend pattern. Wave C (third wave) was confirmed as spread took out the June low of 1.4284 during September. The next downside target area is between 1.3994 and 1.37302, the 50% and 61.8% retracement levels of the previous major uptrend from 1.2876 (August 2022) through the April 2023 high of 1.5112. Theoretical Positions: Traders might’ve liquidated longs from the August 2022 close of 1.31904 near the May 2023 close of 1.45107 (a gain of 0.13203) and establish new short positions (short euro/long Canadian dollar). Additional short positions could’ve been established below the Wave A low of 1.4284, putting the average position at 1.43973. Stops would be placed above the Wave B high of 1.48813 (July 2023).
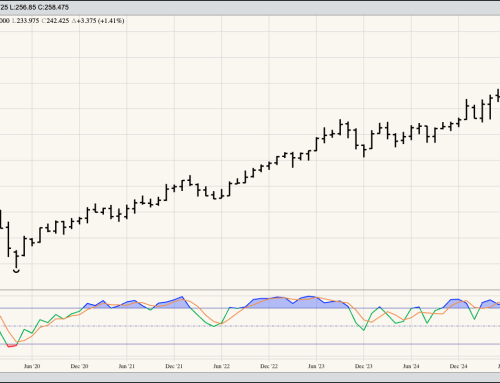
The Canadian dollar (^CADUSD) still looks to be in a major uptrend, though the loonie posted a new 4-month low of 0.71984 during October. I still see the loonie in Wave 2 of its major 5-wave uptrend pattern. Theoretical Positions: Traders could be long from the October 2022 close of 0.73395. Additional longs could be established near the March settlement of 0.73975, putting the average long near 0.73685. Also, additional longs may have been established during June a the loonie took out its previous 4-month high of 0.75398. If so, the average long position would now be 0.74256. If sells stops were triggered below the previous 4-month low of 0.73238 from May, then the average loss would’ve been 0.01018. Otherwise, stops are below the October 2022 low of 0.71550.
The Brazilian real (^BRLUSD) remains in a major uptrend, though the real fell to a new 4-month low of 0.19165 during October. Theoretical Positions: New long positions were established when the real took out its previous high of 0.20214 from February, with additional longs established as the real took out the May high during June. This puts the average position at roughly 0.20346. It’s possible these positions were stopped out with the move to a new 4-month low during October. If not, stops would now be placed below the October low.