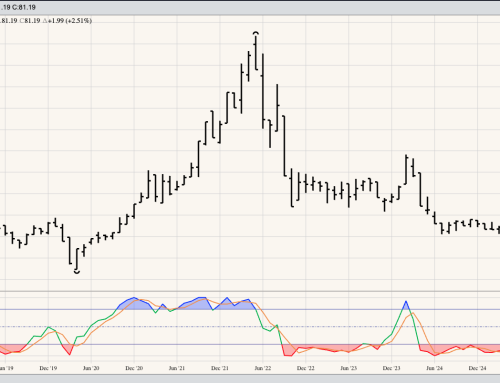
The US dollar index ($DXY) extended its major (long-term) uptrend to a high of 109.29 during July. This was the highest the index has been since September 2002 when it reached 109.77. And while the $DXY finished the month back at 105.90, it was still 1.22 above the June settlement meaning no bearish reversal patter was completed. Monthly stochastics remain above 80% indicating the $DXY continues to be in an overbought situation, bit it has been since late 2021 without generating sustained selling interest. Shorter-term, the secondary (intermediate-term) remains up, for now, while the minor (short-term) trend could turn back up this coming week.
The euro (^EURUSD) took out its previous major low of 1.03498 posted during May as it extended the long-term downtrend to 0.99522 during July. As one would expect, the euro remains sharply oversold with monthly stochastics well below 20% and having completed a number of bullish crossover. To this point it hasn’t been enough to generate consistent buying interest. The move below par with the US dollar brought short-term buying to the market as the euro has closed higher the past two weeks. If it is to establish a major uptrend it will need to hold the July low. The minor trend still looks to be up on the daily chart.
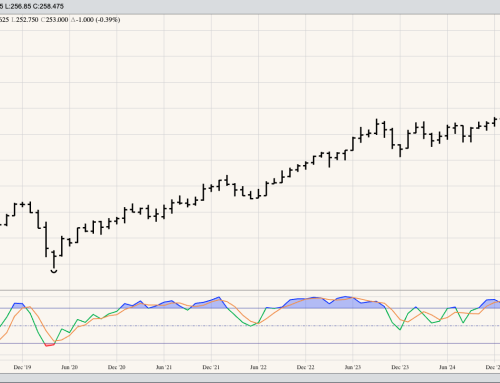
The Canadian dollar (^CADUSD) continues to show a choppy long-term pattern on its monthly chart. Despite closing higher for the month, the loonie is still showing a pattern of lower lows and lower highs, fitting the definition of a downtrend. That being said, the July low of 0.75622 was a direct test of the downside target at 0.75720, the 50% retracement level of the previous uptrend from 0.68170 (March 2020) through the high of 0.83269 (June 2021). Given what we saw during July the loonie looks to have completed a bullish spike reversal, indicating the major trend has turned up. Note this occurred without monthly stochastics crossable below the oversold level of 20%. Nevertheless, the reversal pattern could bring long-term buyers back to the market.
The Brazilian real (^BRLUSD) posed a bullish spike reversal on its monthly chart, hinting at potential investor buying interest once August gets under way. If we squint our eyes just right we continue to see a series of higher lows and higher highs, the definition of a long-term uptrend. Initial support is the July low of 0.18131 with resistance the previous 4-month high of 0.21773 from April 2022.