


Side Note: For the record, I’m in agreement with Warren Buffett’s thoughts on technical analysis, at least in the Energies sector. Buffett has said on the subject, “I realized that technical analysis didn’t work when I turned the chart upside down and didn’t get a different answer.” To emphasize this point, the market making the most sense, from a technical point of view, is Natural Gas (aka the Widow Maker). That tells us all we need to know.
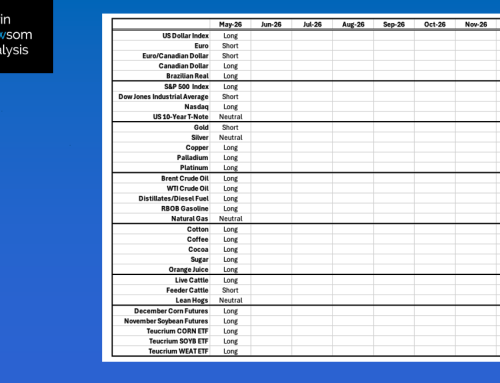
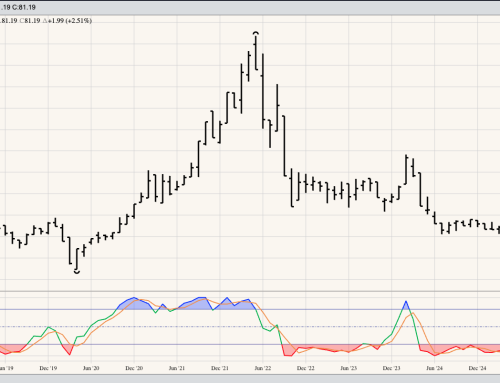
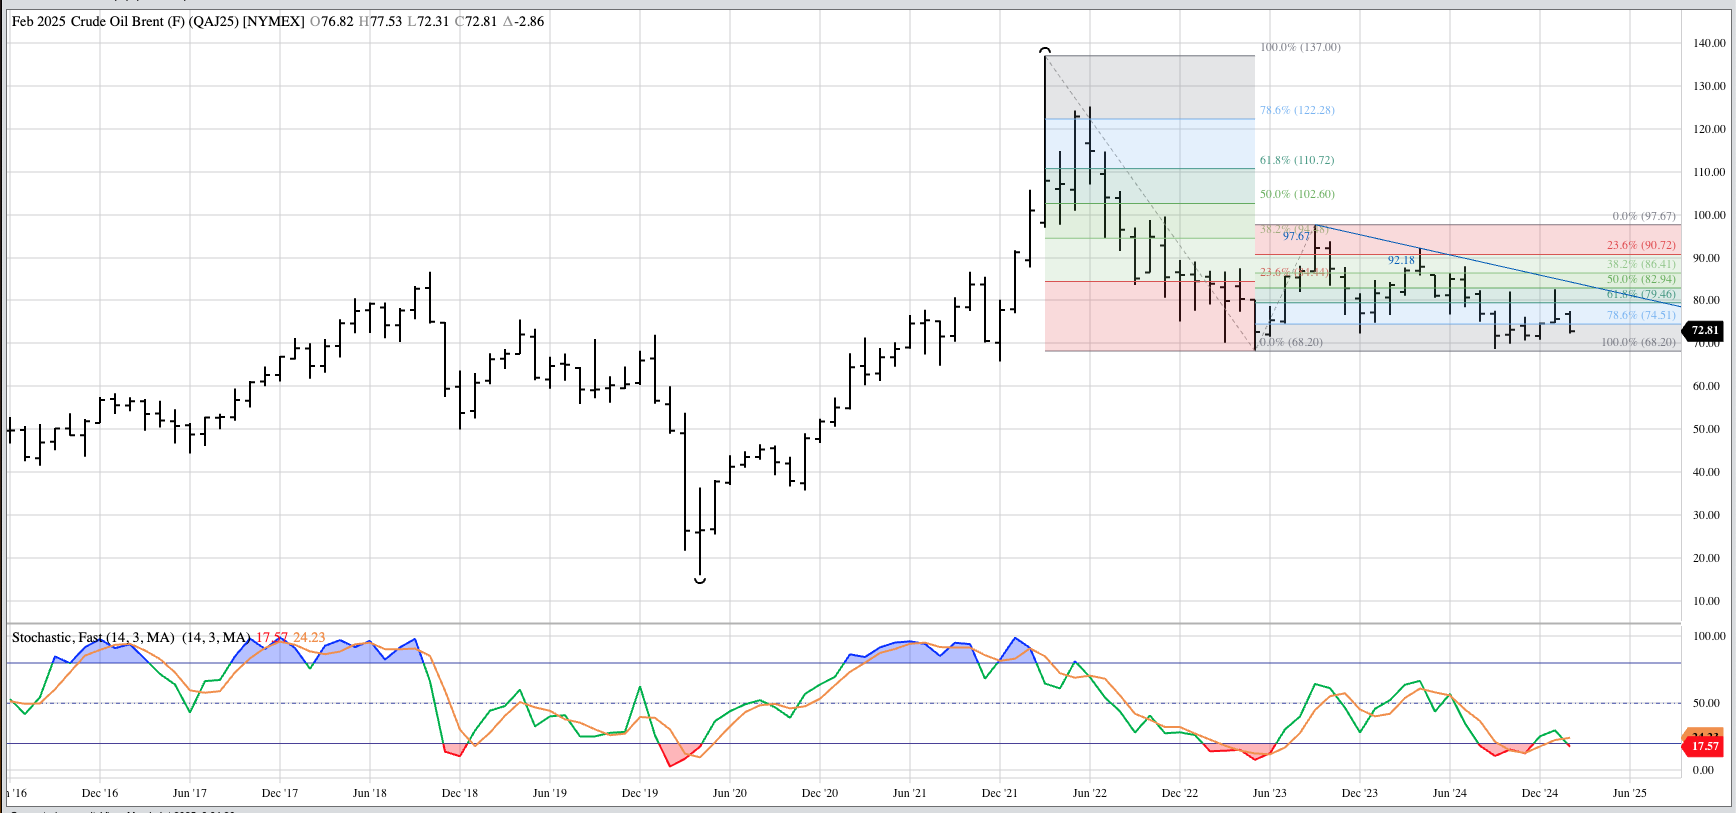
Brent crude (QA) remains in a major (long-term) sideways trend, despite the market’s backwardated forward curve. This structure of a sideways trend and bullish fundamentals has been in place for months. The most recent indicator is a bullish crossover by monthly stochastics below the oversold level of 20% at the end of October indicating the major trend could soon turn up. Theoretical Positions: Long-term investors are likely on the sidelines for now.
WTI crude oil (CL) remains in a major sideways trend, despite the market’s backwardated forward curve.his structure of a sideways trend and bullish fundamentals has been in place for months. Theoretical Positions: Long-term investors are likely on the sidelines for now.
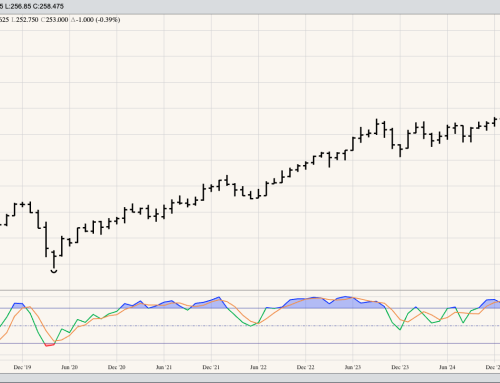
Distillates (HO, heating oil, diesel fuel, jet fuel, etc.): The market looks to have moved into a major uptrend with a clear break of the previous 4-month high of $2.4183 during January. Theoretical Positions: Traders might have bought on the bullish breakout, with sell stops below the previous low of $2.0431. The spot-month contract closed February at $2.3549, down 4.24 cents for the month.
RBOB gasoline (RB) remains in a major sideways trend. However, the spot-month contract did complete a bearish outside month during February. Theoretical Positions: Traders have likely moved to the sidelines at this time.
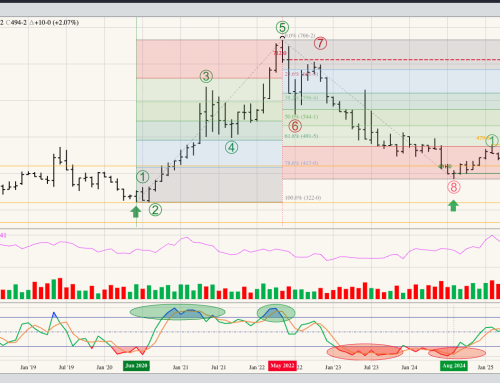
Natural gas (NG) remains in a major uptrend. Theoretical Positions: Traders might’ve gone long on the bullish breakout above $2.168 during May 2024. Additional long positions may have been established above the May high of $2.924 during June. Additional longs may have been added near the August close of $2.127 based on the spot-month contract completing a bullish spike reversal, indicating a Wave 2 low. Another set of long positions might’ve been added during February as the spot-month contract took auto the January high of $4.369. If so, then the average long position would be roughly $2.897 with sell stops below the previous 4-month low of $2.514 from November 2024.