
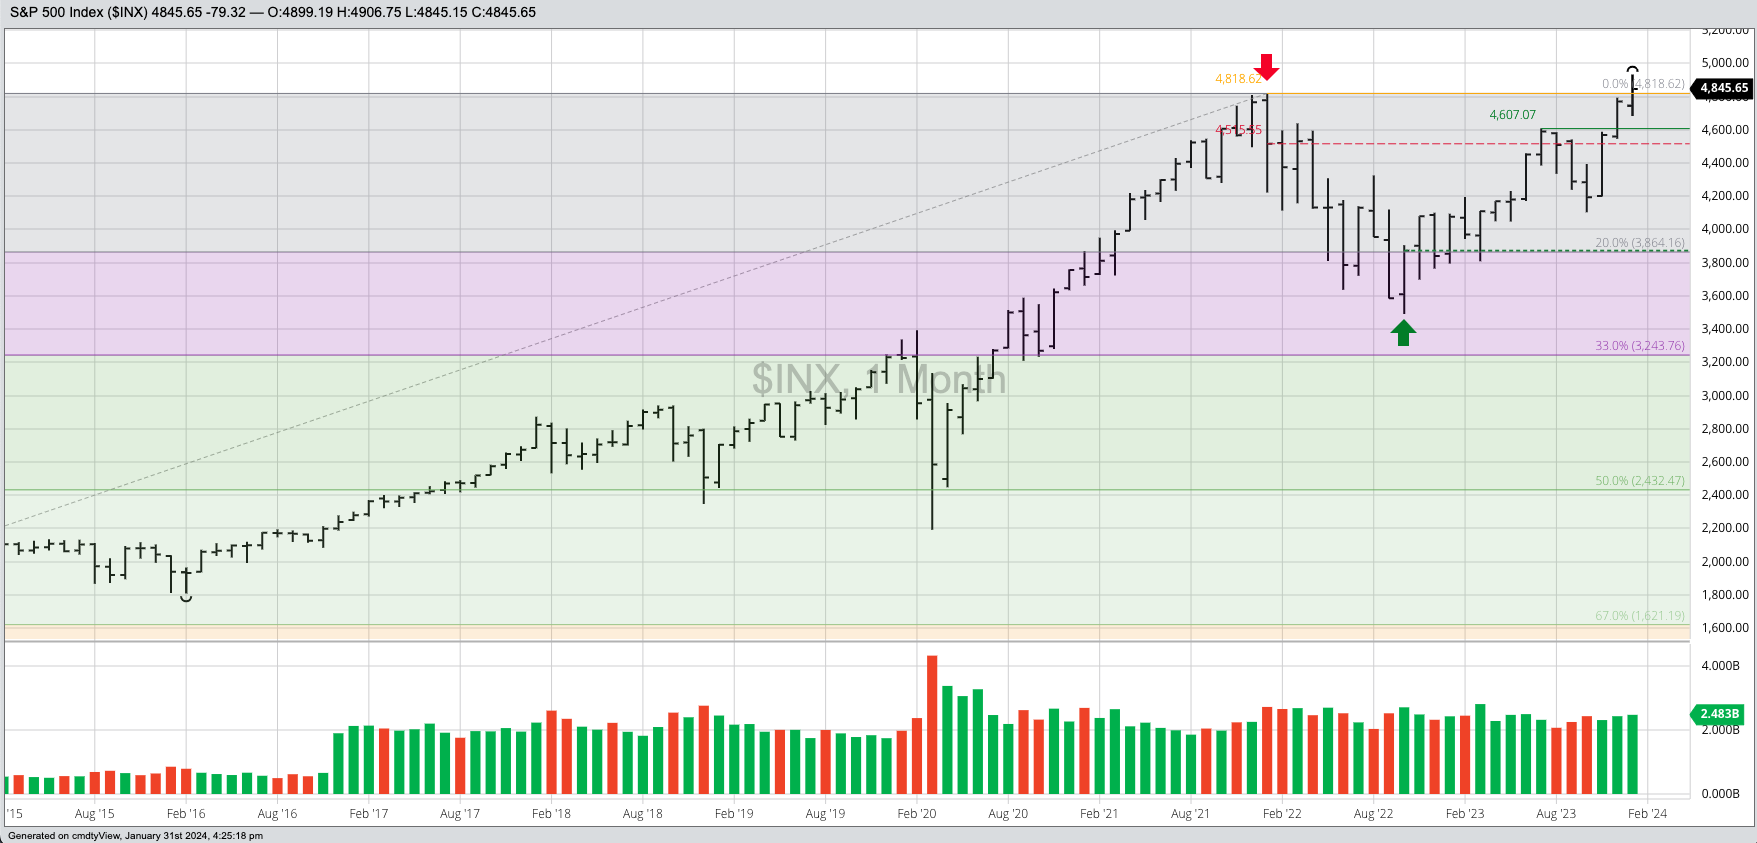


The S&P 500 ($INX) remains in a major (long-term) uptrend, posting a new all-time high of 4,931.09 during January before closing at 4,845.65, up 75.82 for the month. Seasonally the $INX tends to move lower during February and March (see Seasonal Analysis). Theoretical Positions: Long from the October 2022 close of 3,871.98.
The Dow Jones Industrial Average ($DOWI) remains in a major (long-term) uptrend, posting a new all-time high of 38,588.86 during January before closing at 38,150.30, up 460.76 for the month. Seasonally the $DOWI tends to move lower during February and March. Theoretical Positions: Long from at least the October 2022 settlement of 32,732.95 if not the breakout of the September high at 32,504.04.
The Nasdaq ($NASX) remains in a major uptrend. The $NASX posted a high of 15,630.58 during January with its all-time high at 16,712.23 from November 2021. Theoretical Positions: Long from the October 2022 close of 10,988.15.
The US 10-year T-note (ZN) remains in a major uptrend despite consolidating during January. Initial resistance is at the series of highs from March through May 2023 near 117-000, with the next upside target near 118-275. The latter marks the 38.2% retracement level of the previous major downtrend from 140-235 (March 2020) through the low of 105-105 (October 2023). Theoretical Positions: New longs might’ve been established near the November 2023 close of 109-150. Others may be waiting for a retracement. Either way, sell stops would be placed below the October 2023 low of 105-105.


