
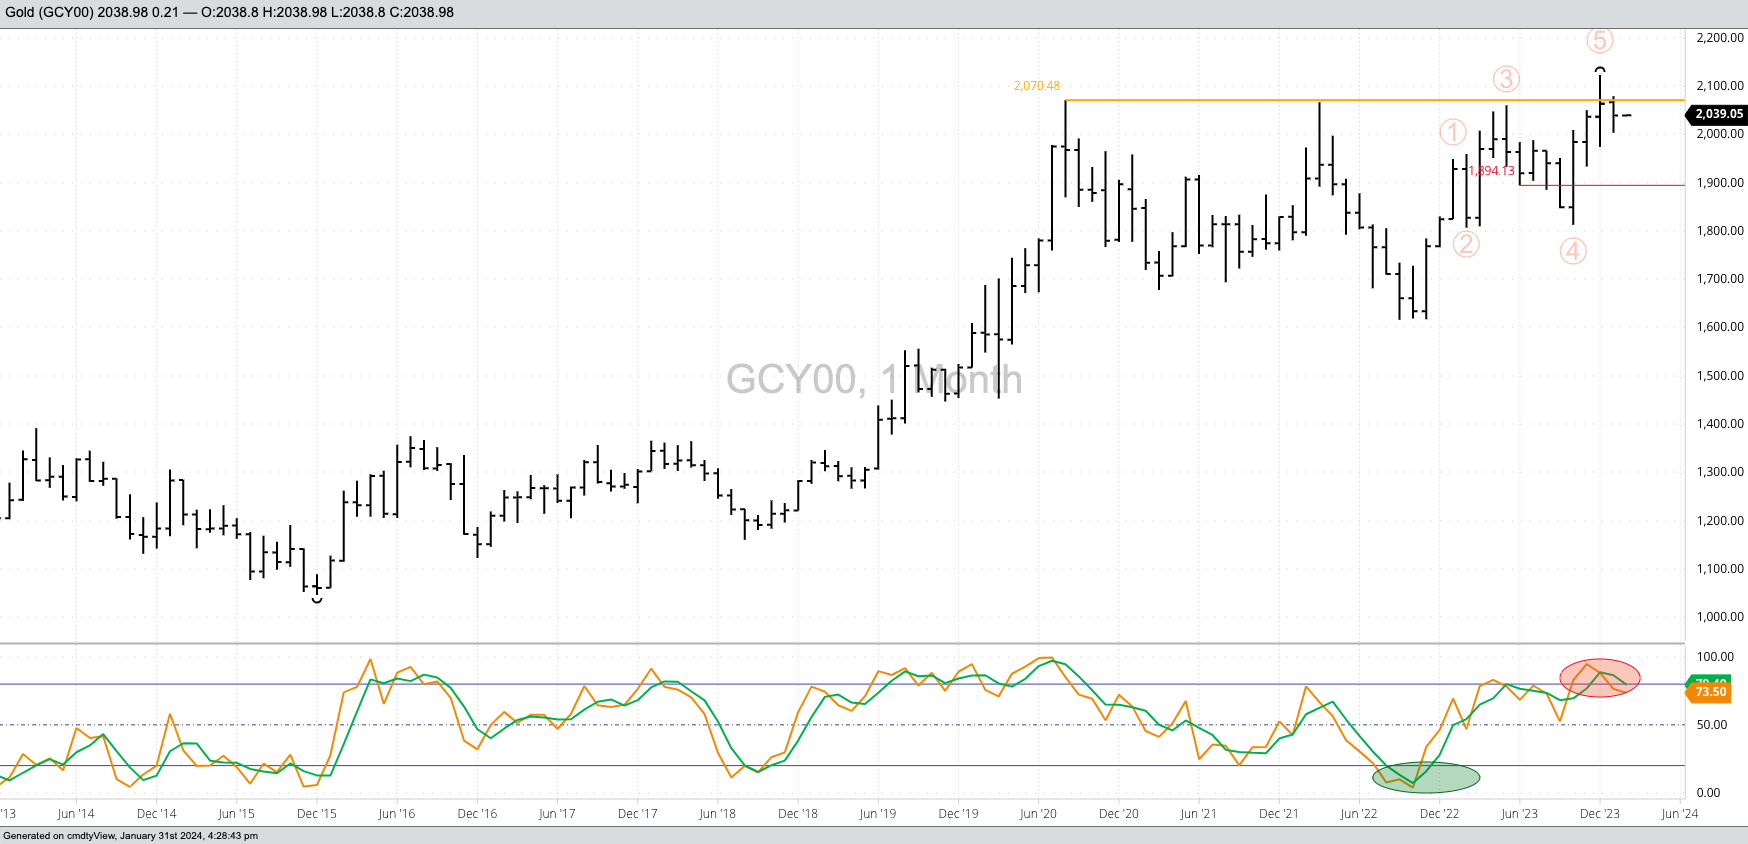


Gold (Cash Index): The cash index (GCY00) consolidated during January after posting a new all-time high of $2,122.65 during December. It could still be argued the major (long-term) is set to turn down, based on the bearish crossover by monthly stochastics above the overbought level of 80% at the end of December. As of the end of January there has been no bearish reversal pattern to confirm a new major downtrend. Theoretical Positions: It’s possible investment traders bought near the October 2023 close of $1,983.91 as previous short positions were stopped out.
Silver (Cash Index): The cash index (SIY00) remains in a major sideways trend, now between its 4-month high of $25.769 (December 2023) and 4-month low of $20.7168 (October 2023). Since September 2022 there have been a number of bullish and bearish reversal patterns completed. Theoretical Positions: Investment traders are likely on the sidelines at this time. The most recent move to a new 4-month high (November 2023) was immediately followed by a bearish spike reversal.
Copper (Cash Index): The cash index (HGY00) is also in a major sideways trend on its monthly chart. However, the index did post a new 4-month high during December, taking out the previous $3.8935 from August 2023. Theoretical Positions: It’s possible investment traders bought as the new 4-month high was posted during December. If so, sell stops would be below the 4-month low of $3.5420 (October 2023).


