

Note: I’ve changed the Monthly Analysis of the Grains sector, looking at the long-term investment side with ETFs for the three major markets as well as continuous December corn and November soybeans monthly charts. I’ll discuss the National Cash Indexes for the five major markets (corn, soybeans, three wheats) in Monthly Supply and Demand Commentary based on the idea these Indexes are the key read on real fundamentals.
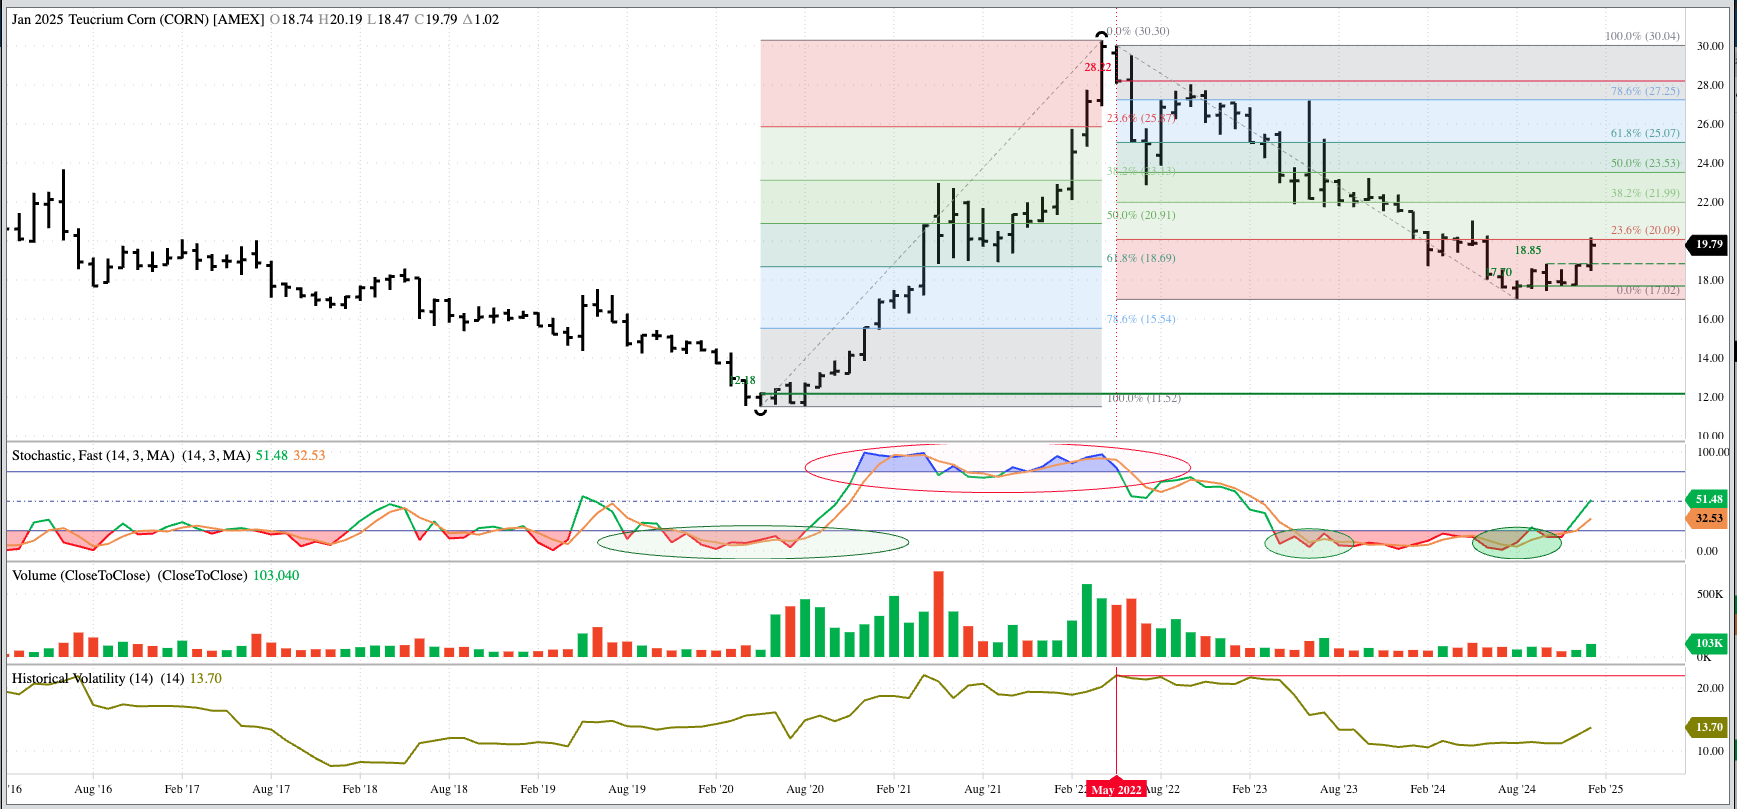
Teucrium Corn Fund (CORN) extended its major (long-term) uptrend to a high of $20.19 during January before closing at $19.79, up $1.02 for the month. The initial upside target is $21.99 (just below the round number $22), a price marking the 38.2% retracement of the previous major downtrend. Theoretical Positions: CORN could’ve been bought near the August settlement of $17.70. Additional longs could be established on buy stops above the previous 4-month high of $18.85 during January. Sell stops would be moved to below the previous 4-month low of $17.45 (October 2024), or left below the major low of $17.02 from August 2024.
December Corn: Dec25 extended the major uptrend to a high of $4.6725 during January before closing at $4.6025, up 16.5 cents for the month. A pocket of old trade is between $4.46 (February 2024) and $5.13 (December 2023) before the next upside target near $5.30, the 38.2% retracement level of the previous major downtrend from $7.6625 (May 2022) through the low of $3.85 (August 2024). We need to keep an eye out for Dec25 turning sideways, similarly to what it did from the fall of 2014 through the fall of 2020 with the initial high occurring during December 2014.
Theoretical Positions:
- Hedgers:
- See Weekly Analysis: Grains (both Futures and Cash)
- Investors:
- Short Dec24 futures positions could’ve been covered near the August 2024 close of $4.01.
- And long positions established at the same price
- These long positions could’ve been rolled to Dec25 at a carry of 25.5 cents on Monday, October 28
- Dec24 was at (roughly) $4.1325
- Dec25 was at (roughly) $4.3875 (new long positions)
- Dec25 closed last Friday at $4.6025
- Implied volatility on Dec25’s daily chart is high at 23%
- Combined with the completion of a bearish key reversal on the contract’s weekly chart
- Short-dated new-crop call options could be sold
- The March $4.60 was priced at 7 5/8 cents at Friday’s close
- These options expire on Friday, February 21
- The bottom line is Investors/Traders will want to still be long Dec corn based on the bullish spike reversal at the end of August on the continuous monthly chart confirming the end of the previous long-term downtrend from May 2022 (See Monthly Analysis)
- The Dec25/Dec26 futures spread closed last week at a carry of 2.25 cents
- Technically, Friday’s close broke support at the 2.0-cent carry level
- Long-term investors could roll long Dec25 futures to Dec26 at 2.25 cents carry or less
- Short Dec24 futures positions could’ve been covered near the August 2024 close of $4.01.
The Teucrium Soybean Fund (SOYB) extended its major uptrend to a high of $22.58 during January before closing at $22.16, up $0.68 for the month. Recall SOYB completed a bullish spike reversal at the end of December, turning the major trend up. Theoretical Positions: Investors would’ve bought near the December settlement of $21.48 with sell stops below the December low of $20.20.
November Soybeans: The continuous monthly chart for November soybeans continues to show a major sideways trend. Support is at the August 2024 low of $9.55 with resistance the high of $10.6975 from September. Nov25 hit a high of $10.66 during January before closing at $10.51, up 25.75 cents for the month. Theoretical Positions: Traders would’ve gotten out of short November 2024 futures positions before the contract moved into delivery at the end of October. New Nov25 positions are on hold for now, though sell stops could be below the August low of $9.55 with buy stops above the September high of $10.6975.
The Teucrium Wheat Fund (WEAT) remains in a major uptrend, though the last few months have shown the characteristic Krampus Countdown (Don’t be long wheat in December) and Head Fake Phenomenon. A close look at the monthly chart shows WEAT took out its December low of $4.65 by $0.01 during January before turning around and completing a bullish key reversal. WEAT closed January at $4.95, up $0.13 (A lucky 13?) for the month. Theoretical Positions: Investors might’ve gone long WEAT near the December settlement of $4.82. Additional longs could be established near the January settlement of $4.95, putting the average position near $4.89.