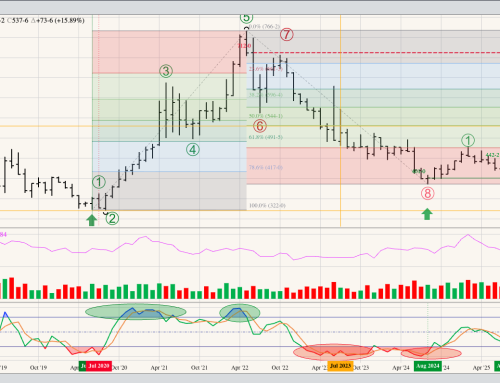
Soybean Cash Index: The National Soybean Index (ISY00, national average cash price) could still be considered in an uptrend, though we have to be careful given the selloff seen during late June. The key is the double bottom lows of $10.7872 (February 2024) and $10.7996 (April 2024) for a move below those would indicate the NSI was back on track to hit the downside target of $10.25 (monthly close only) from April 2023. Theoretical Positions: Remaining cash bushels from the 2023 harvest would’ve been sold on sell stops below the October low of $11.8872. End users could extend their cash coverage based on the slowly building major uptrend . If long-term long positions were established near the March settlement of $11.34, sell stops would be below the February low of $10.78. Keep in mind the long-term downside target for the NSI on its monthly close-only chart near $10.25.
November Soybeans: The November 2024 contract confirmed a move back into a major (long-term) downtrend as it took out the previous 4-month low of $11.2275 in late June. Despite being oversold, with monthly stochastics well below 20%, Nov24 posted a low of $11.00 before closing at $11.04, down 80.5 cents for the month. Theoretical Positions: If traders went long Nov24 in early April near the March settlement of $11.8625, they would’ve been stopped out below the February low of $11.2275. These same traders may have rolled into new short futures at the same time.
The Teucrium Soybean Fund (SOYB) rolled back into a major downtrend as it took out its February low of $23.79 during June. SOYB posted a month low of $23.57 before closing at $23.65, down $1.62 for the month. Theoretical Positions: If investors reestablished long positions near the March settlement of $25.21 based on a bullish 2-month reversal, these positions would’ve been stopped out below the February low of $23.79 for a loss of roughly $1.43.