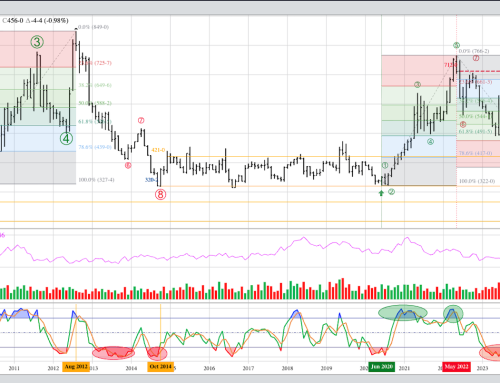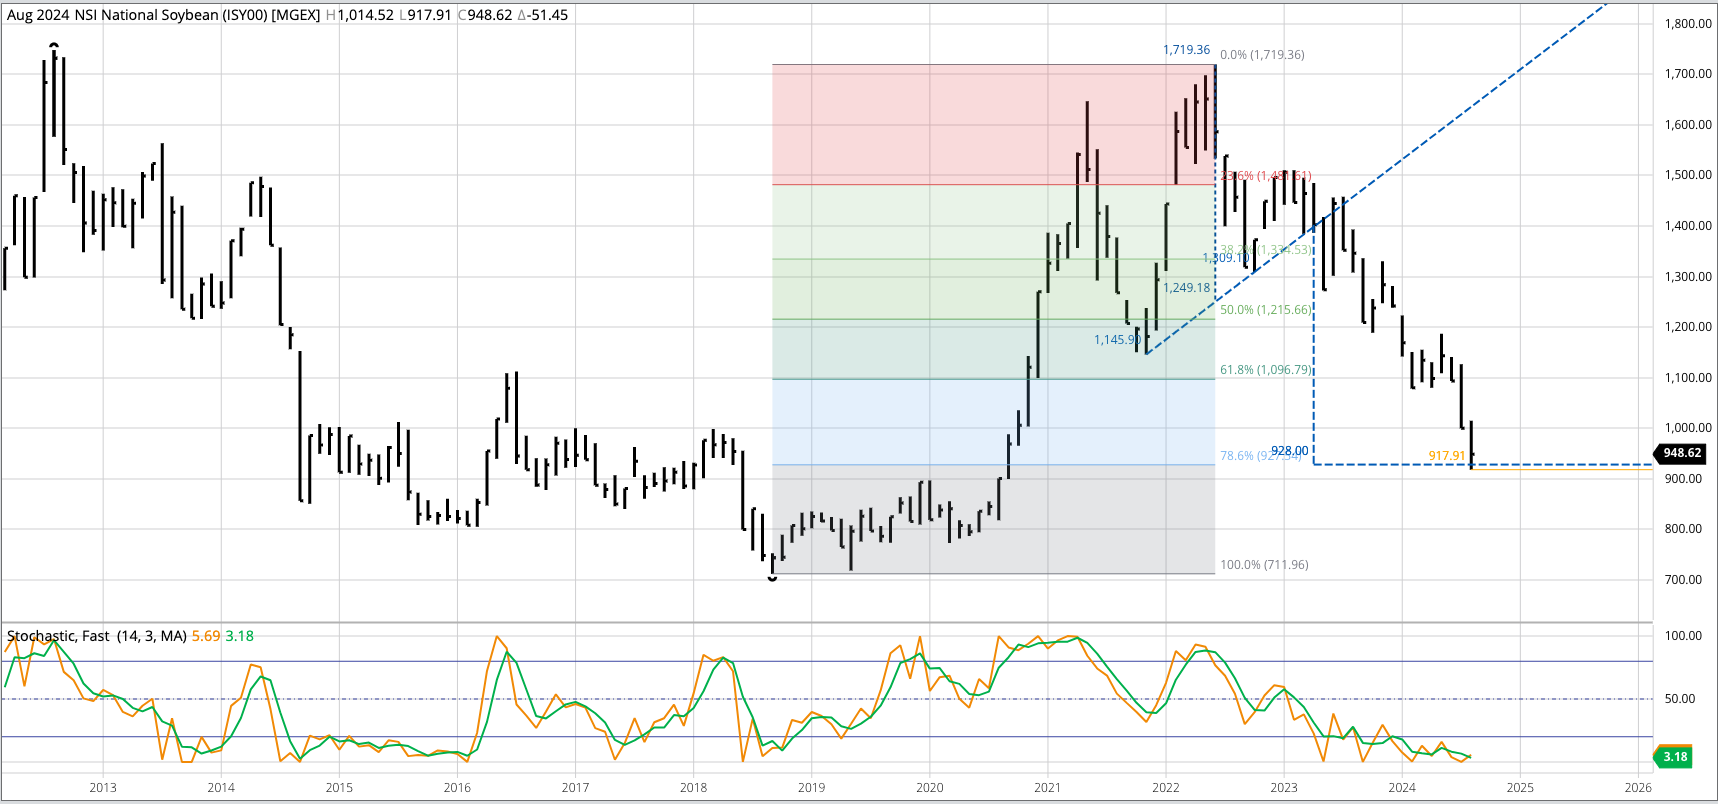


Soybean Cash Index: The National Soybean Index (ISY00) extended its major (long-term) downtrend to a low of $9.1791 during August before settling the month at $9.4862, down 51.45 cents from the end of July. This completed the head and shoulder top formation on the NSI’s monthly chart with a target near $9.28. However, monthly stochastics did establish a bullish crossover below the oversold level of 20% indicating the major trend could soon turn up. Theoretical Positions: End users would continue to buy on as-needed basis until a clear bullish reversal is completed.
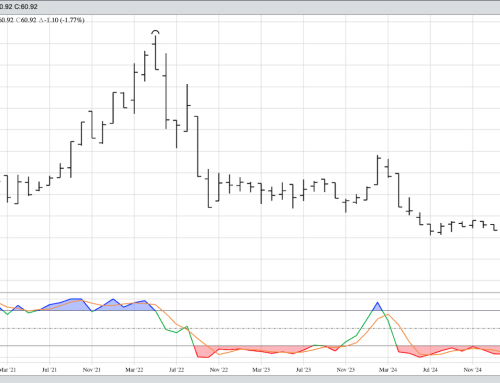
November Soybeans: The November 2024 contract extended its major downtrend to a low of $9.55 during August. This was the lowest mark for a Nov soybean contract since $9.4275 is September 2020. While Nov24 did not complete a bullish reversal last month, stochastics established a bullish crossover below the oversold level of 20% indicating the major trend could soon turn up. Theoretical Positions: Traders could still be short Nov24 from near the February 2024 low of $11.2275. Given the bullish monthly stochastics and low implied volatility of the futures market, call options could be bought near the August settlement. The Nov24 $10 call option closed August at 27 5/8 cents.
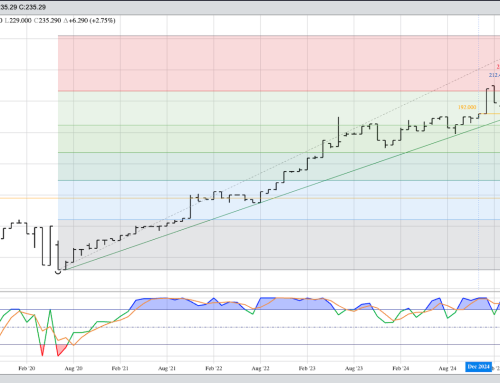
The Teucrium Soybean Fund (SOYB) extended its major downtrend to a low of $21.02 before closing August at $21.86, down $0.45 for the month. While SOYB did not complete a bullish reversal pattern during
August, monthly stochastics completed a bullish crossover below the oversold level of 20% indicaiong the major trend could soon turn up. Theoretical Positions: Investors are likely on the sidelines, waiting for completion of a bullish reversal pattern, confirming a move to a new major uptrend. Call options could be bought based on the bullish crossover by monthly stochastics.