
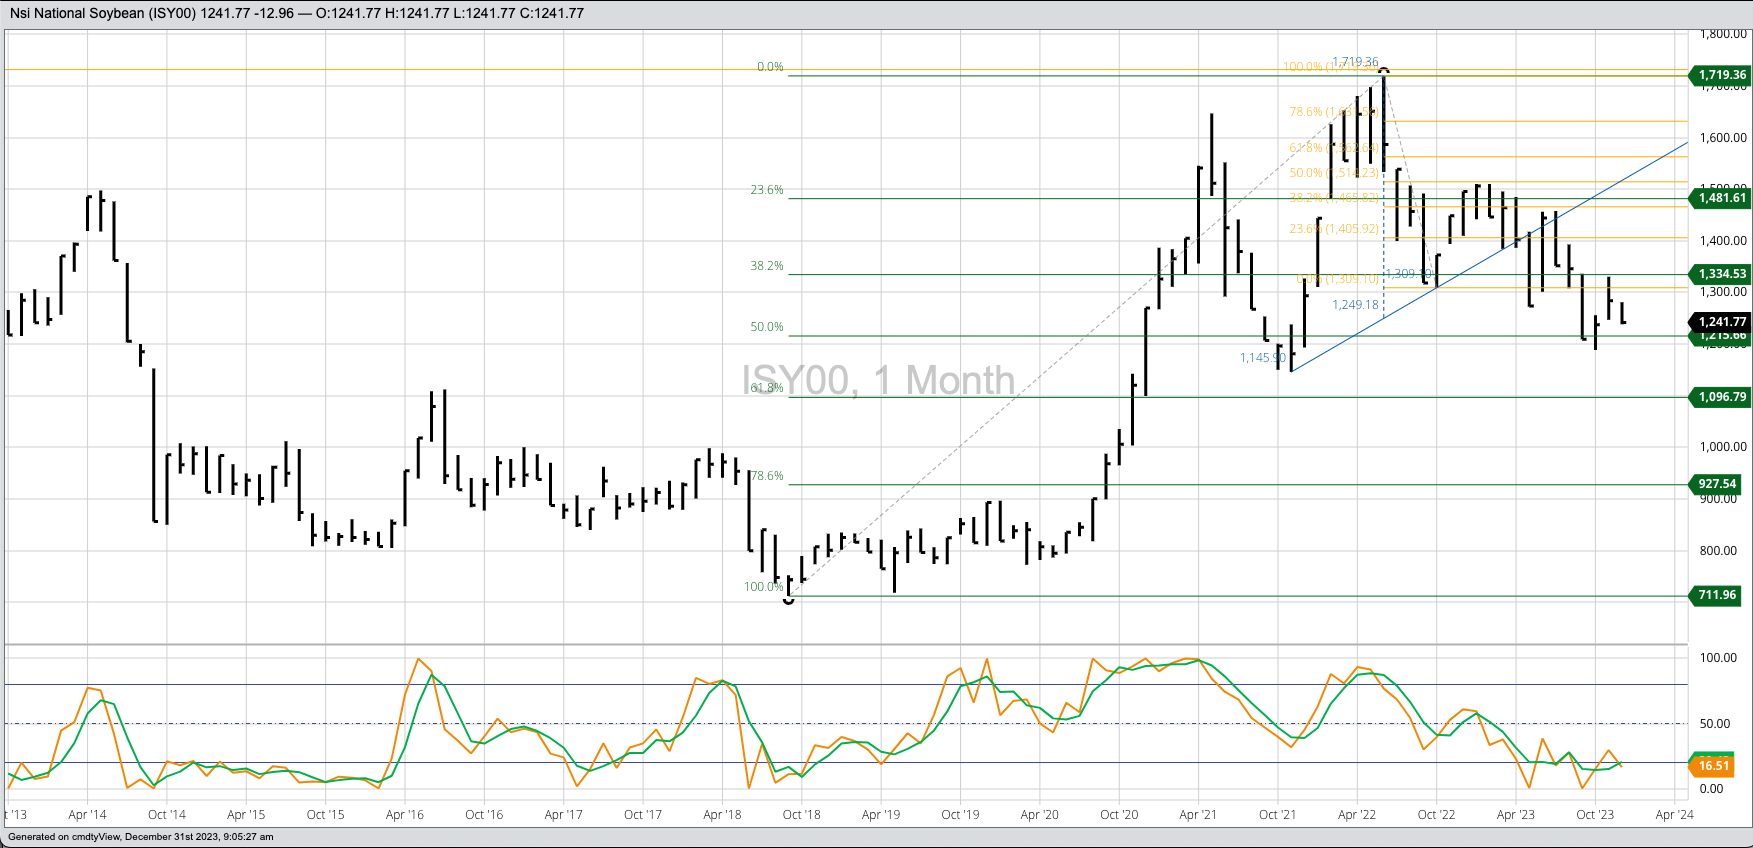


Soybean Cash Index: The Soybean Price Index (ISY00, national average cash price) still looks to be in a major (long-term) uptrend despite the selloff and lower close during December. Key support is the October low of $11.8872 with the ISY00 finishing December at $12.41775. On the bearish side, I still see a head and shoulder topping pattern that projects a much deeper selloff (see Monthly Supply and Demand for January 2024). Theoretical Positions: Remaining cash bushels from the 2023 harvest could be held, with sell stops below the October low. End-users could cover long-term needs, also with an eye on the long-term low. Traders could be long the market from near the October settlement of $12.3756 with sell stops below the October low of $11.8872.
November Soybeans: The November 2024 contract posted a new 4-month low of $12.4450 during December before closing the month at $12.4575. The market still looks to be in a major uptrend based on the bullish 2-month reversal completed at the of June. The ongoing selloff looks to be Wave 2 of the 5-wave pattern putting the retracement target near $11.91. Theoretical Positions: Given 2024-2025 futures spreads remain bullish, there are likely few sales on the books versus the Nov24 contract. Sell stops might’ve been triggered below the previous 4-month low of $12.5050 (October 2023, the Nov23 contract).
The Teucrium Soybean Fund (SOYB) monthly chart remains a mess. The key price is the previous 4-month low of $26.59 from October. If this is taken out, SOYB has room to fall to the next low of $23.83 (May 2023). Theoretical Positions: Investors might’ve gone long at the June close of $27.32. If so, technically, sell stops would be below the previous 4-month low of $26.59 from October 2023.


