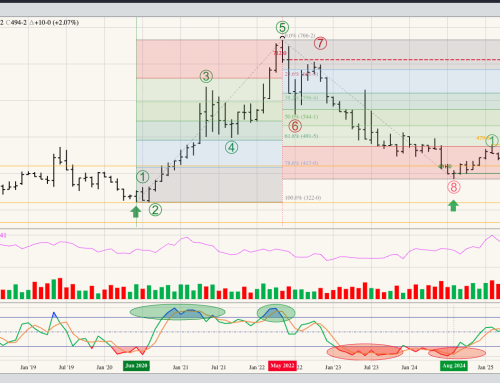
The Barchart National Soybean Price Index (NSPI, intrinsic value of the market) remains in a major 3-wave downtrend with the ongoing rally off the Wave A low (October) of $12.9987 looking to be Wave B. The NSPI hit a high of $15.0980 during January, a test of the upside target of $15.1682, the 50% retracement level of Wave A from $17.3377 (June 2022) through the low of $12.9987 (October 2022). It this was the peak of Wave B, then Wave C would be expected to take out the Wave A low. The next downside target is all the way back at $12.2037. Theoretical Positions: Short from the June settlement of $15.9058 based on the completion of a bearish key reversal. Additional shorts may have been put in place with the move to below the previous 4-month low of $15.1946 during July. If so the average short would be roughly $15.55.
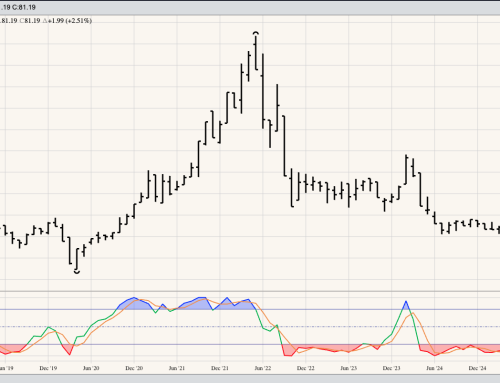
November Soybeans: The major trend remains down, with short Nov22 positions rolled to Nov23 during October. The target is the July 2022 low of $12.8850. Theoretical Positions:
- Short Nov23 from roughly $13.5975 (October 12)
- Previously short Nov22 from the June close of $14.58 (the completion of a bearish key reversal)
- Bought back on October 12 at $13.96 for a gain of roughly 62.0 cents
- Raising the short Nov23 to about $14.1275
- With a stop above the previous 4-month high of $15.0875
- Previously sold Nov22 $13.40 put options for approx. 55.0 cents on August 3
- Stopped out at approx. 9.0 cents on September 23 for a gain of roughly 46.0 cents
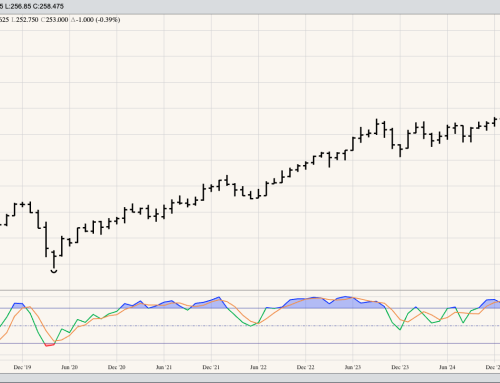
The Teucrium Soybean Fund (SOYB) remains in a major downtrend with the recent rally to the December high of $28.73 looking to be Wave B (second wave) of the 3-wave pattern. If so, then Wave C would be expected to take out the Wave A low of $24.26 (July 2022) with the next downside target at $23.17. This price marks the 38.2% retracement level of the previous uptrend from $13.27 (April 2020) through the high of $29.29 (June 2022). Theoretical Positions: Longs were sold at the June 2022 close of $27.06 based on the completion of a bearish key reversal.