The bottom-line supply and demand number is stocks-to-use (s/u). I’ve long said stocks-to-use are the Readers’ Digest version of supply and demand, in that one number can tell us the bullishness, bearishness, or neutrality of a market’s fundamentals. I’ve also argued endlessly over the years with economists, my point being there should be a direct correlation between stocks-to-use and cash price. Given this premise, I’ve developed my system between the two for all three major markets (wheat, corn, and soybeans) with the r-squared[I]for all three near 100%. In all cases I’m using the cmdty National Cash Price Indexes (weighted national average cash prices from Barchart), and in wheat that means HRW, SRW, and HRS have been weighted to reflect US production of all wheat supplies. The Darin Newsom Analysis, Inc. (DNAI) stocks-to-use numbers are calculated at the end of every month, and then compared to the previous month and the previous year. The DNAI numbers may not agree with subsequent USDA report estimates, but that is understandable given the DNAI numbers are real (based on national average cash prices) rather than imaginary (based on…I have no idea).
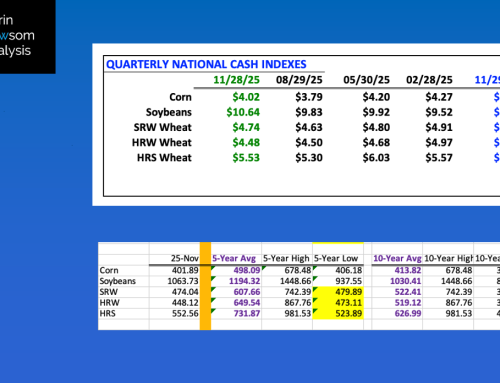
WHEAT: The 2021-2022 combined daily average cash price for the three major wheat markets was $7.04 at the end of October, correlating to a s/u figure of 25.5%. The end of September showed s/u of 26.6% and the previous October 45.8%. The key here is US wheat supply and demand continues to tighten and could soon reach critical levels. That having been said, some of the markets are showing indications of renewed commercial pressure with spring wheat basis weakening 14 consecutive to close out October while the December-March Chicago (SRW) futures spread closed the month covering a neutral-to-bearish 65% calculated full commercial carry.
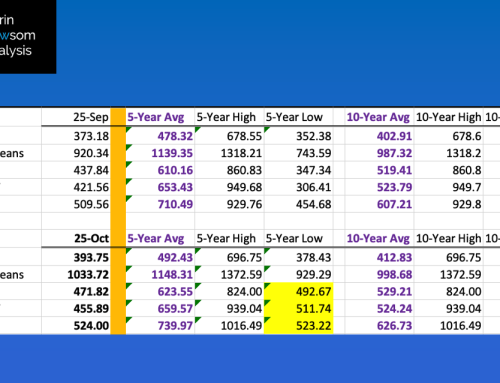
CORN: The 2021-2022 daily average of the NCPI though the end of October was calculated at $5.14, up slightly from the September average of $5.12. The October average kept my s/u calculation at 9.8%, still far tighter than the 12.4% figure at the end of October 2020. Taking a look at the attached chart should give us pause as available s/u has not increased appreciably during the 2021 harvest, with the end of August calculation coming in at 9.6%. Given most reports are of higher than expected yields this tells us a couple things: 1) Demand continues to run strong, a factor also confirmed by the continued strength of national average basis as October came to an end, and 2) Lots of bushels are being tucked away in storage and held off the market for now.
SOYBEANS: The 2021-2022 daily average of the NSPI though the end of October was calculated at $12.12, down from the September average of $12.37. The October average increased my s/u calculation to 0.4% from September’s 0.3% with both still well below the October 2020 figure of 3.5%. As the attached chart shows, the bottom line is US available s/u remain incredibly tight. The month of October saw national average basis start to strengthen again despite producers selling soybeans at harvest to make room to store corn.
[i] R-squared is defined as “a statistical measure of fit that indicates how much variation of a dependent variable is explained by the independent variable in a regression model.” (Investopedia). In my world, it is how closely related two (or more) variables are, in this case national average cash price and stocks-to-use.