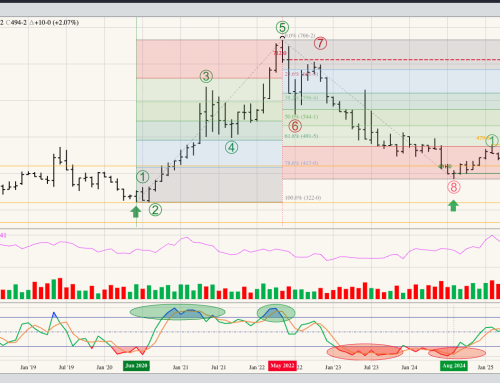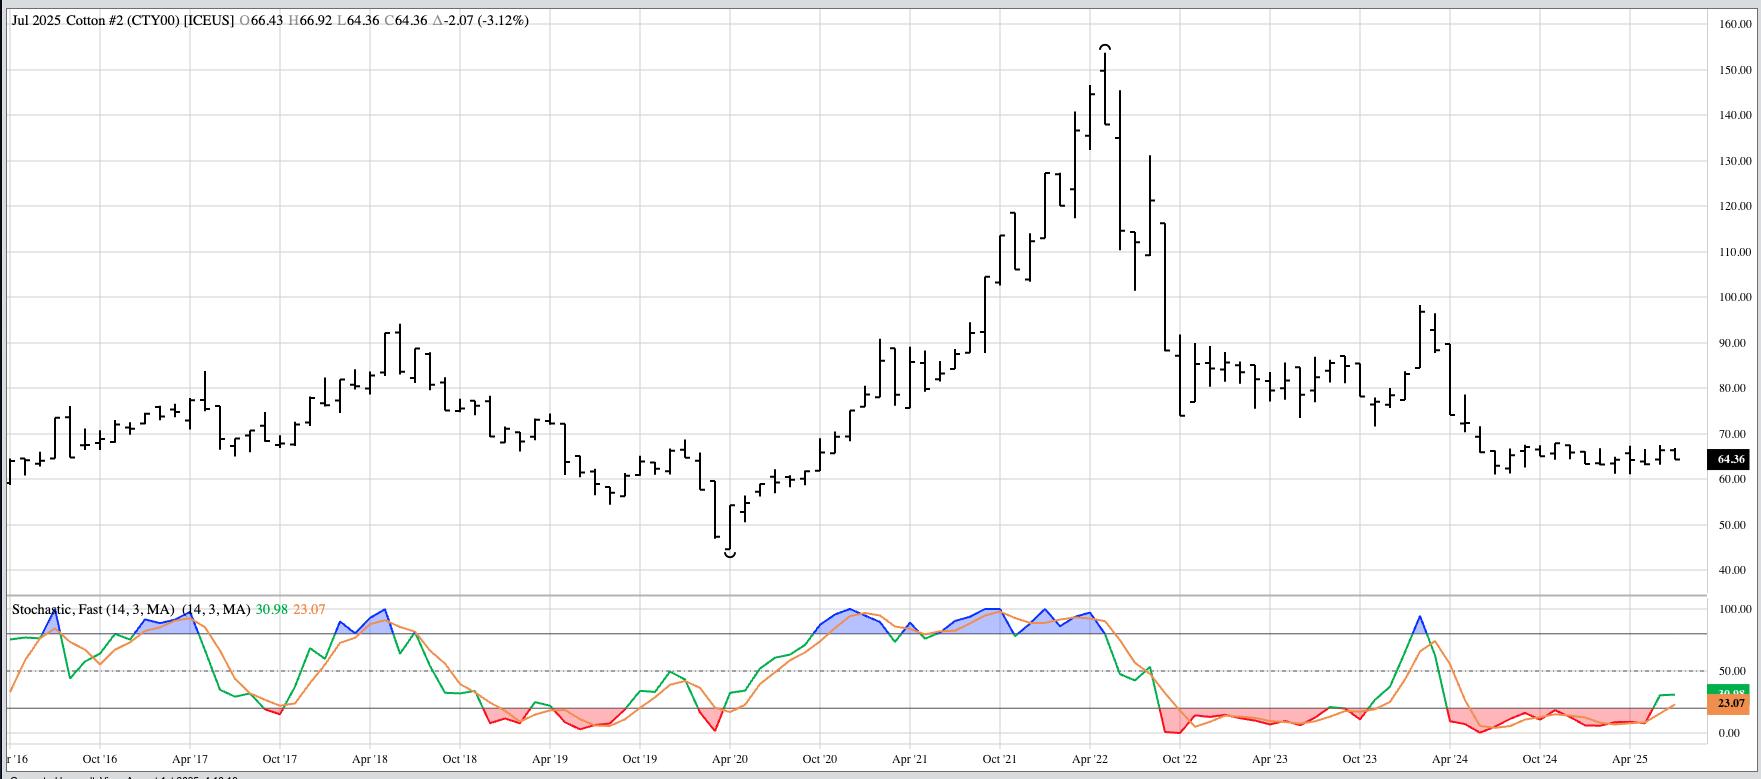


Cotton (CTY00, Cash Index): I keep going back and forth on a major (long-term) uptrend or sideways trend. Yes, the index hit a new 4-month high during June but found no follow-through buying interest in July. Theoretical Positions: Long-term investors might’ve bought on the move to a new 4-month high of 67.43 during June. If so, then sell stops would be below the April 2025 low of 61.11. The index closed July at 64.36, down 2.07 for the month.
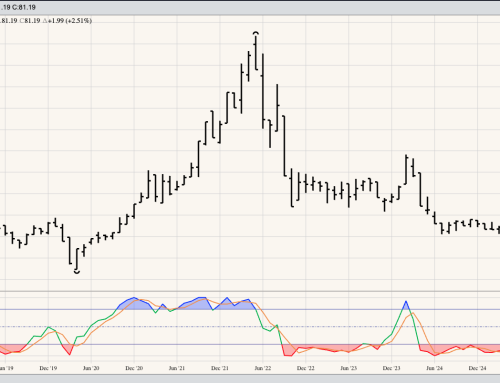
Coffee (KCY00, Cash Index): The Index extended its major downtrend to a low of 308.50 during July before closing at 318.48, down 13.35 for the month. This was a test of the 50% retracement level of 308.63, possibly leading to a Wave B (second wave) rally within the 3-wave downtrend pattern. Theoretical Positions: Long-term investors might’ve gone short the market on sell stops below the previous 4-month low of 362.37. Sell stops would be placed above April highs (depending on which futures contract one uses).
Cocoa (CCY00, Cash Index: It could still be argued the Index is in a major downtrend as it took out its previous 4-month low of 7,837 during July. Meanwhile, the futures market’s forward curve remains in strong backwardation indicating a long-term bullish supply and demand situation. Theoretical Positions: Long-term investors are likely on the sidelines in cocoa. If holding short positions, buy stops would be above the previous 4-month high of 10,927 (May 2025).
Sugar (SBY00, Cash Index): After extending its major downtrend to a low of 15.56 in July, the Index completed a bullish spike reversal by closing at 16.35, up 0.16 for the month. This coincided with another bullish crossover by monthly stochasitcs below the oversold level of 20%, both indicating and confirming a move to a new major uptrend. Theoretical Positions: Long-term investors could buy near the July close of 16.35 with sell stops below the July low of 15.56.
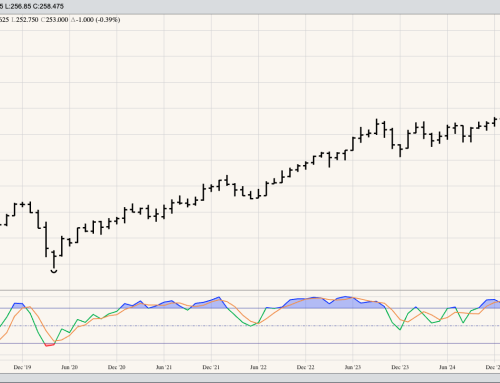
Orange Juice (OJY00, Cash Index): The Index completed a bullish key reversal during July, following a similar pattern completed this past April, the former coinciding with a bullish crossover by monthly stochastics. This means the index both signaled (stochastics) and confirmed (key reversal pattern) a new major uptrend. Theoretical Positions: Long-term investors bought back short positions near the April close of 272.50 and went long at the same price. It’s possible sell stops below the April low of 211.90 were triggered during July before another buy was signaled at the end of the month. The Index closed July at 260.15, up 45.15 for the month but well off its high of $337.85.