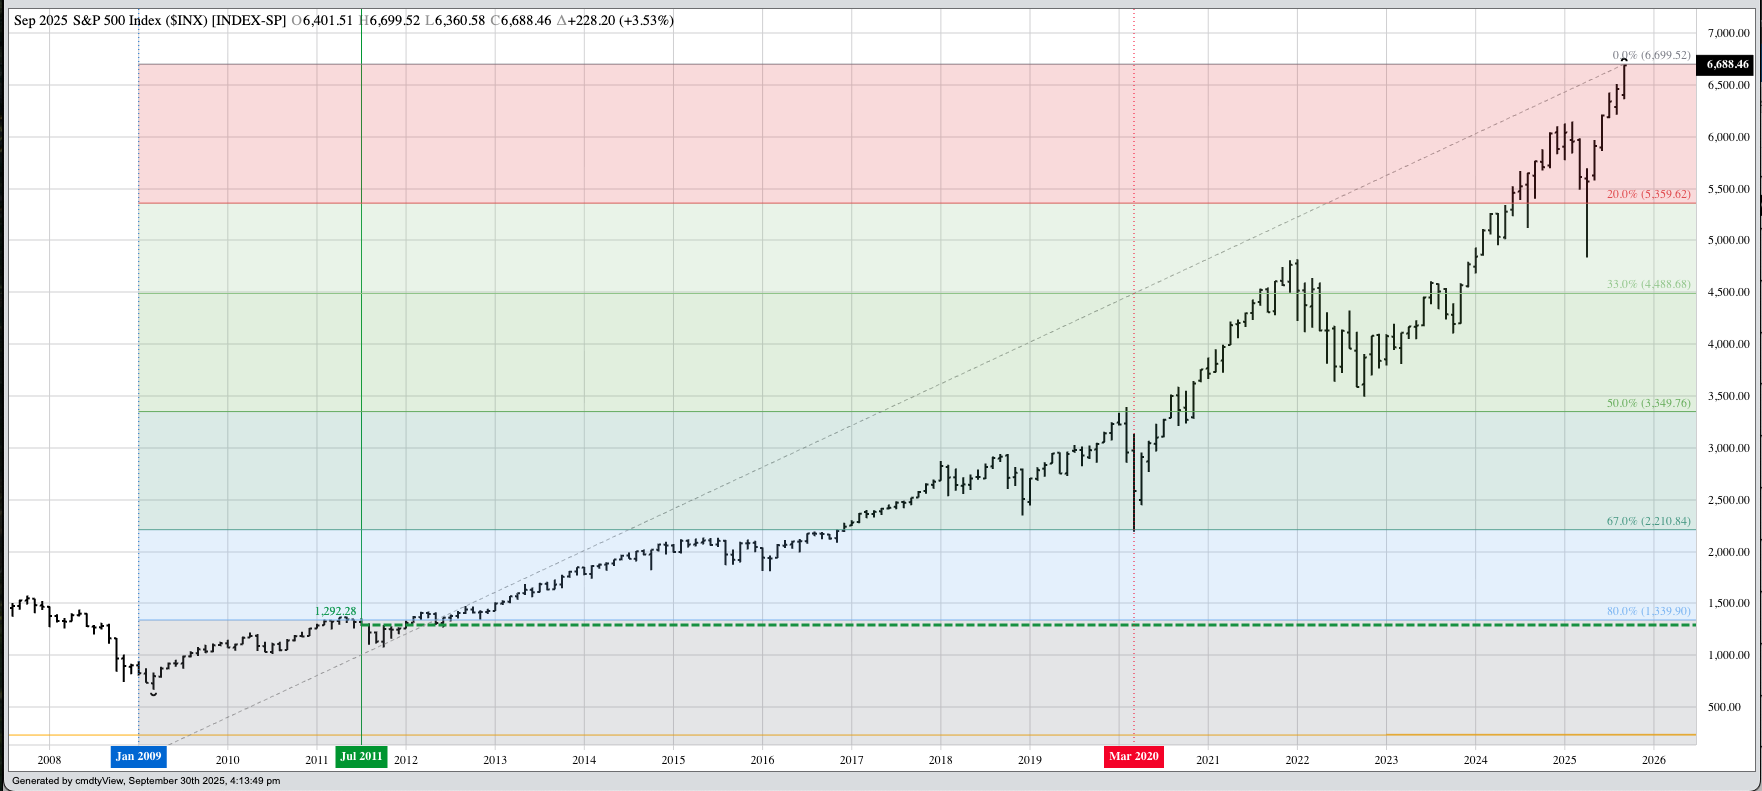


The S&P 500 ($INX): The bottom line is the Index extended its major (long-term) uptrend to a new high of 6,699.52 during September before closing at 6,686.46, up 228.20 (3.5%) for the month. Theoretical Positions: Long-term investors are likely still long, despite bearish technical patterns this past spring.
The Dow Jones Industrial Average ($DOWI) extended its major uptrend to a high of 46,714.27 during September before closing at 46,397.78, up 853.01 (1.9%) for the month. Theoretical Positions: Long-term investors are likely still long, despite bearish technical patterns this past spring.
The Nasdaq ($NASX) extended its major uptrend to a high of 22,801.90 during September before closing at 22,660.01, up 1,204.46 (5.6%) for the month. Theoretical Positions: Long-term investors might’ve bought back into high-tech stocks in late April.
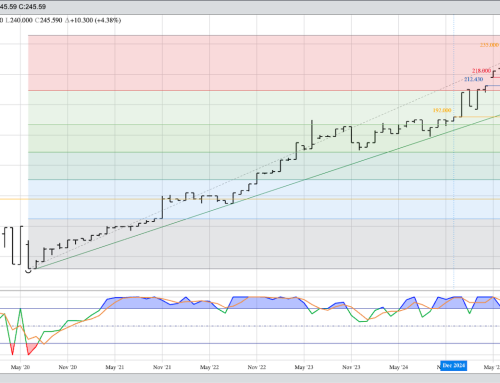
The US 10-year T-note (ZN): I’m going to continue to call the major trend sideways. While the spot futures contract posted a new 4-month high during September, the market fell back through the end of the month. There still looks to be a good deal of uncertainty regarding interest rates, though the eyeball test tells us there is still a majority expecting additional cuts during Q4 2025. The Fed fund futures forward curve (slide 5) indicates this could happen at the conclusion of the December meeting (December 10). Theoretical Positions: New longs might’ve been established near the November 2023 close of 109-150. Additional positions could’ve been established near the April 2024 close of 107-140. Another round of long positions could’ve been put in place during August 2024 as the ZN took out its Wave 1 high. Additional longs could be established near the November 2024 close, raising the overall position average to roughly 110-250. Investors could’ve added long positions on a move beyond the previous 4-month high of 111-155 (December) during March 2025. Sell stops would be below the June low of 109-300.