
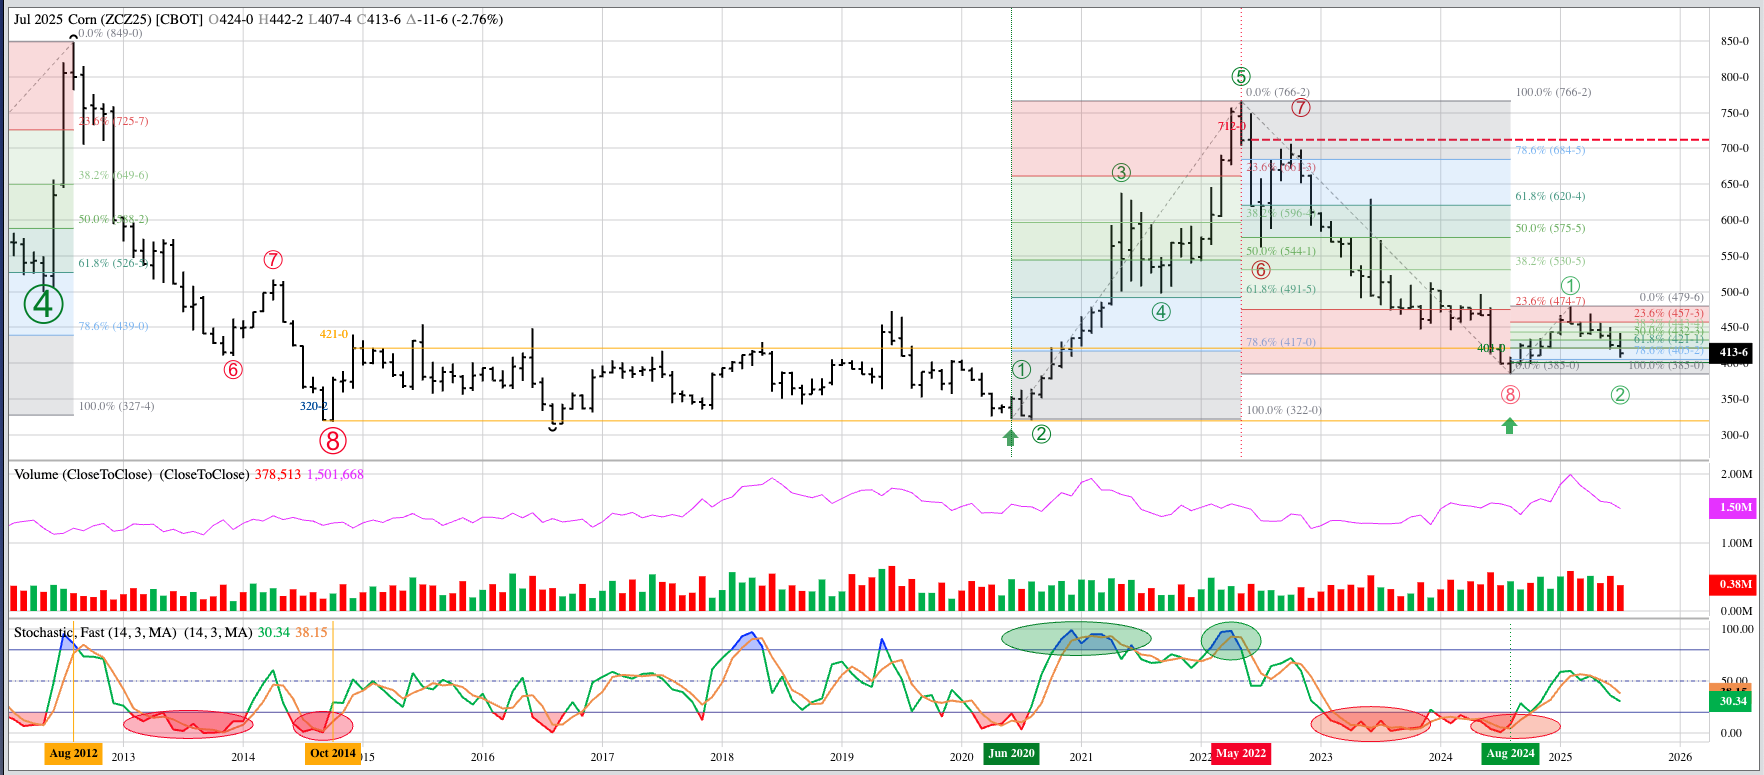


December Corn: It’s likely Dec25 established the high-end of a potential major (long-term) sideways range back in February at $4.7975, similar to what occurred during the winter of 2014-2015. Recall this sideways pattern would last through the fall of 2020. If Dec corn is in a new major sideways trend with a high-end near $4.80, the low end would be the August 2024 low of $3.8550. The range back in 2014 to 2020 was from the low near $3.20 (September and October 2014) through the highs near $4.20.
Theoretical Positions:
- Hedgers:
- See Weekly Analysis: Grains (both Futures and Cash)
- Investors:
- Long Dec25 futures from $4.2650 were rolled to Dec26 futures at 2.0 cents carry on Friday, January 31
- Dec25 could’ve been sold at roughly $4.6025
- a gain of approximately 21.5 cents
- in addition to the gain of about 12.0 cents on the previous Dec24 long futures position
- a gain of approximately 21.5 cents
- Dec26 could’ve been bought at roughly $4.6225
- Dec25 could’ve been sold at roughly $4.6025
- Long Dec25 futures from $4.2650 were rolled to Dec26 futures at 2.0 cents carry on Friday, January 31
- The bottom line is long-term Investors will want to still be long Dec corn based on the bullish spike reversal at the end of August 2024 on the continuous monthly chart confirming the end of the previous long-term downtrend from May 2022 (See Monthly Analysis). At the end of July the investment position would be approximately:
- Short Dec25 near $4.81 based on a number of short-term option trades
- Dec25 closed June at $4.1375
- Long Dec25 $4.20 calls at 20 cents
- using half the gains from previous short option positions
- Long Dec26 near $4.6225
- Dec26 closed April at $4.5025
- Short Dec25 near $4.81 based on a number of short-term option trades
Teucrium Corn Fund (CORN) is also in a major sideways trend. CORN closed July at $17.26, down $0.43 for the month after posting a low of $17.11. This held the August 2024 mark of $17.02. Theoretical Positions: CORN could’ve been bought near the August 2024 settlement of $17.70. Additional longs could be established on buy stops above the previous 4-month high of $18.85 during January. If so, then the average position would be near $18.28. Sell stops would be below the major low of $17.02 from August 2024.
November Soybeans: The continuous monthly chart for November soybeans continues to show a major sideways trend. Theoretical Positions: Traders would’ve gotten out of short November 2024 futures positions before the contract moved into delivery at the end of October. There are no November 2025 positions at the end of June.
The Teucrium Soybean Fund (SOYB) looks to be in a major sideways trend. July saw SOYB close at $21.21, down $0.57 for the month. support remains at the previous 4-month low of $20.59 (April 2025) with resistance at the previous 4-month high of $22.65 (June 2025). Theoretical Positions: Investors might’ve bought near the December settlement of $21.48 with sell stops below the December low of $20.20. Some may have added long positions near the April settlement of $21.47, moving sell stops up to below the April low of $20.59.
The Teucrium Wheat Fund (WEAT) remains in a major downtrend as it posted a new low of $4.29 in late July before closing at $4.35, down $0.09 for the month. This was also a new all-time low monthly close. Theoretical Positions: Investors are likely on the sidelines with WEAT.


