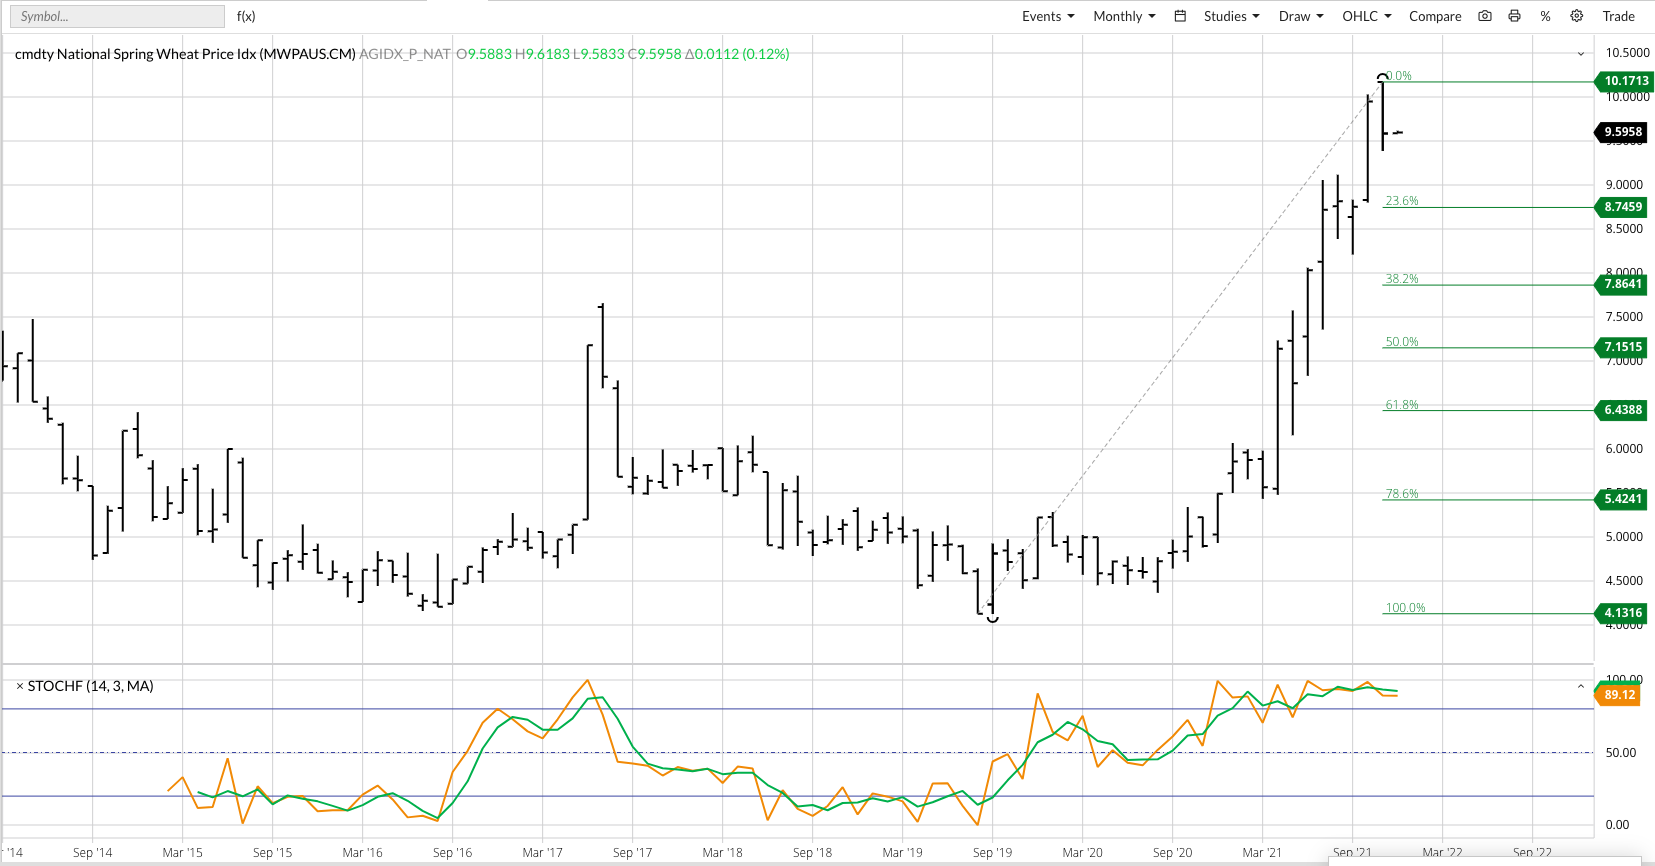
If I were to take the name off this monthly chart and just look at the pattern, my analysis would be the anonymous market posted a bearish spike reversal. This pattern would confirm the new major (long-term) downtrend signaled by a bearish crossover by monthly stochastics at the end of September. But knowing this is the monthly chart for the cmdty National Hard Red Spring Wheat Price Index (HSPI, weighted national average cash price) I immediately question my own technical analysis knowing the market’s forward curve remains inverted. And as we all can say by now, “when it comes to a storable a commodity inverses are bullish”. The third ingredient to our mix is national average basis, with the cmdty National HRS Wheat Basis Index calculated last Friday (the last weekly close of November) at 59.5 cents under December futures. Tuesday’s theoretical calculation of national average basis versus March Minneapolis futures came in at 51.5 cents under, situated between the previous 5-year low weekly close for this week of 56.0 cents under and the previous 5-year average weekly close of 48.7 cents under. My conclusion? The HSPI provides more questions than answers, but if holding some cash spring wheat it looks to be a selling opportunity, from a strictly technical point of view.


