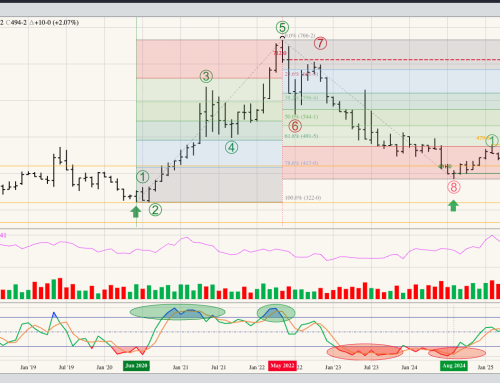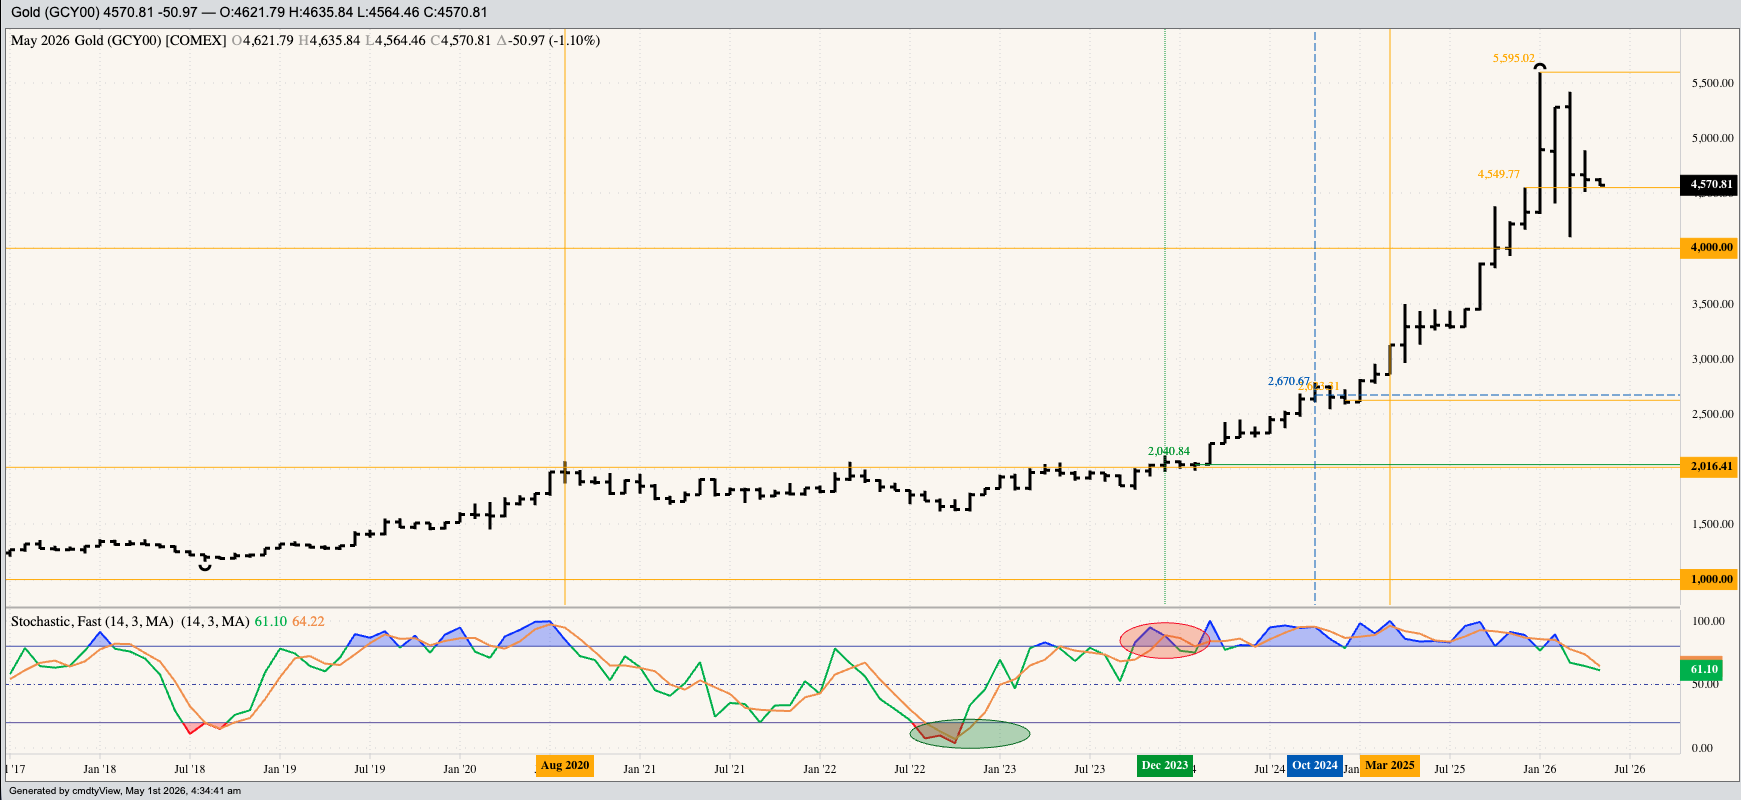


Gold (Cash Index): Gold’s Cash Index looks to have confirmed a major (long-term) downtrend at the end of March, before consolidating during April. Theoretical Positions: It’s possible investment traders bought near the October 2023 close of $1,983.91 as previous short positions were stopped out. There have been numerous buys, mostly on new 4-month highs, since the key bullish reversal completed during November 2022. These positions might’ve been liquidated at the end of March with the completion of a bearish outside month. Monthly stochastics turned bearish at the end of October 2025.
Silver (Cash Index): I do not know what to call silver’s major trend at this time. Theoretical Positions: Investors have likely bought the market numerous times since the initial buy at the close of September 2022. However, these positions may have been stopped out during the March selloff.
Copper (Cash Index): The copper Index may have completed a double-top pattern on its monthly close-only chart with the April settlement of $5.9450. The previous high was $5.98150 from February 2026. The interim low is the March settlement of $5.5910. Theoretical Positions: Investors may have established long positions a number of times over the past few years. Sell stop would be below the interim low monthly close from March 2026.
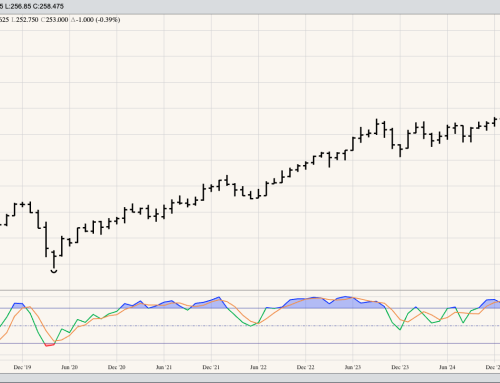
Palladium (Nearby futures): The market remains in a major uptrend. Theoretical Positions: Investors may have established long positions a number of times since the May 2024 low monthly close of $899.20.
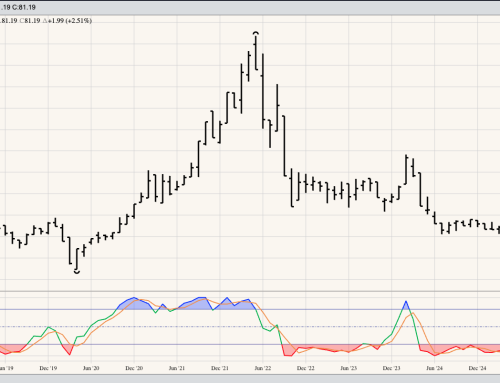
Platinum (Nearby futures): The market could be considered in a major sideways trend between its recent high monthly close of $2,365.50 (February 2026) and $1,950.00 (March 2026). Theoretical Positions: Investors may have established long positions a number of times since the June 2025 breakout monthly close of $1,334.00.