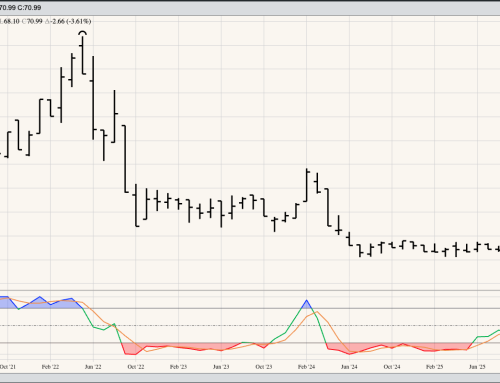
Corn Cash Index: It could be argued the Barchart National Corn Price Index (NCPI, weighted national average cash price) completed a bullish spike reversal at the end of October. However, the NCPI promptly took out its October low of $4.4167 in early November as it posted a low of $4.4112. Still, the cash corn market looks to be forming a long-term bottom, bringing to an end the major downtrend that began with the bearish 2-month reversal at the end of May 2022. Theoretical Positions: If cash needs were bought at the end of May, the previous suggestion was to buy put options as protection, establishing a synthetic call. Otherwise, continue to buy cash corn as needed only until a clear bullish reversal is completed.
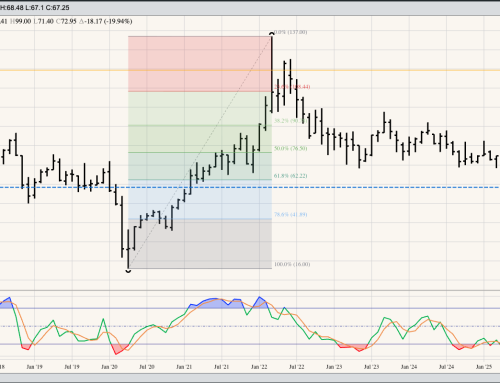
December Corn: I’ll call the major trend sideways for now, with support at the September low of $4.6775. The December 2023 issue will go into delivery at the end of November. The October settlement saw the Dec23-Dec24 spread at a carry of 34.25 cents, putting the 2024 contract at $5.13.
Theoretical Positions:
- Traders: Investors have likely been chopped up the last few months. Based on my analysis there are no positions at the end of October.
- Hedgers: Continue to hold December short hedges with the idea of rolling out to deferred on stronger carry.
Previous Theoretical Positions:
- Short Dec23 from roughly $6.1425 (November 15).
- Previously short Dec22 from the May close of $7.1150
- Bought back on November 15 at $6.6675 for a gain of 44.75 cents
- Raising the short Dec23 position to roughly $6.59
- Previously Sold Dec22 $5.90 put options for approx. 56.0 cents (July 13)
- Stopped out at approx. 6.0 cents (September 23) for a gain of roughly 50.0 cents
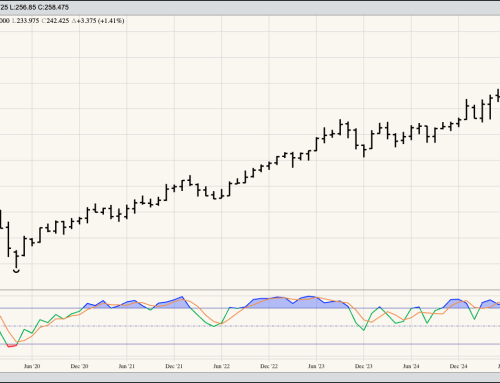
Teucrium Corn Fund (CORN) completed a bullish spike reversal on its monthly chart during July. While CORN sold off during August, it held the July low of $21.74. As September played out, CORN equaled its July low, putting in place a possible double bottom pattern. Heading into November, the previous 4-month high is the October mark of $23.24. Theoretical Positions: New longs might’ve been established near the July settlement of $23.09 with sell stops below the July low of $21.74. Additional longs would be placed above the October high of $23.24.