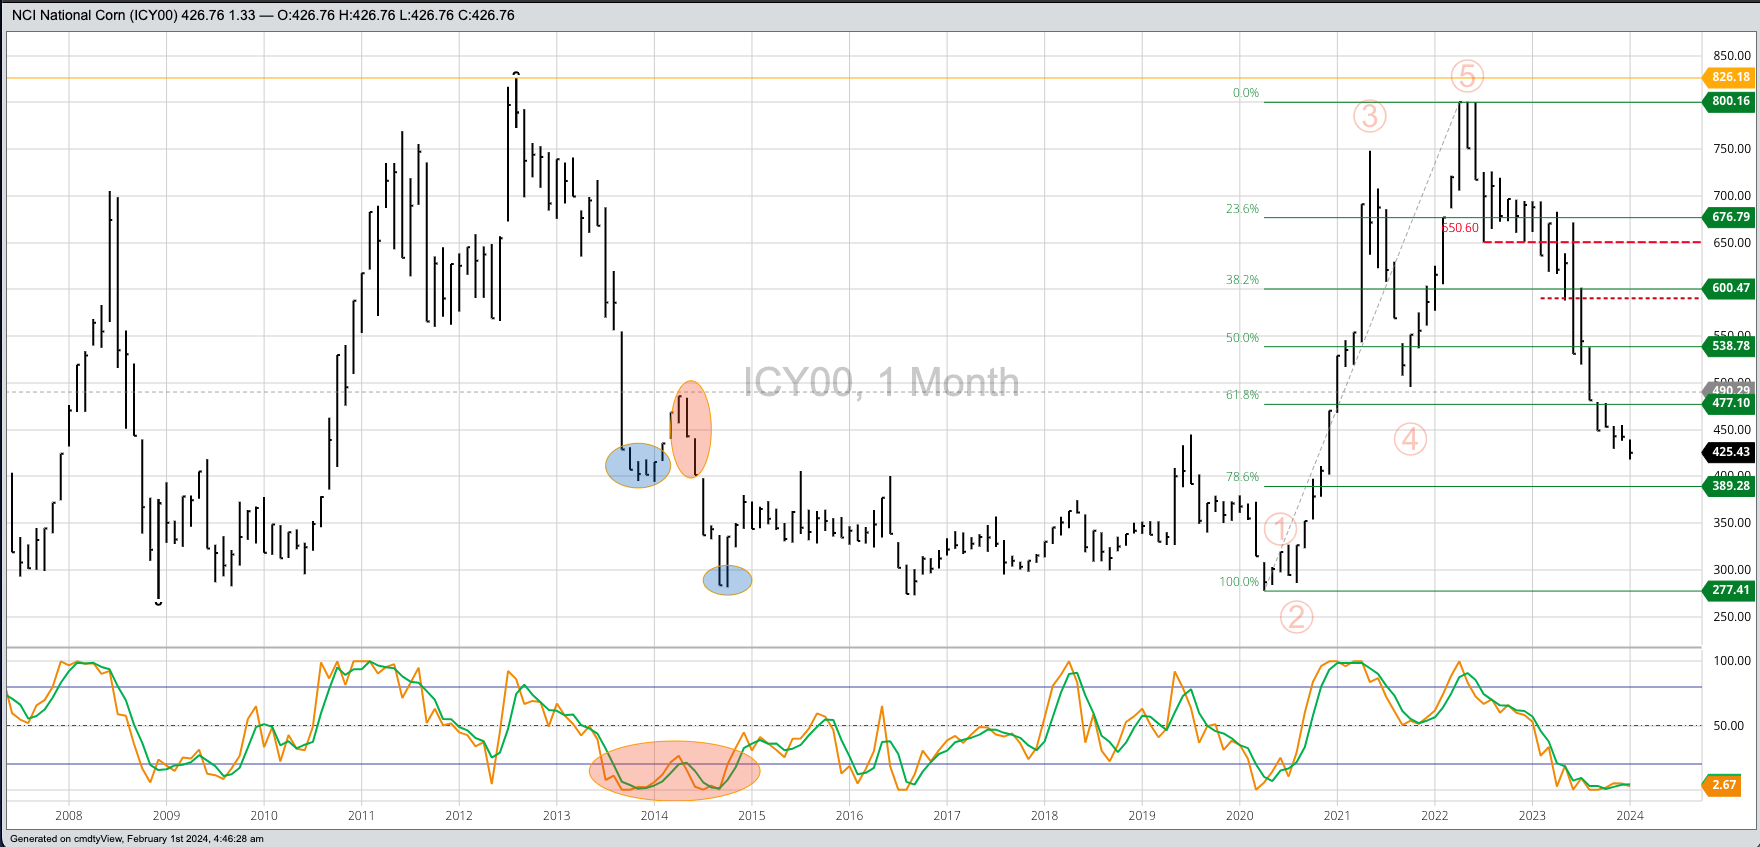


Corn Cash Index: The National Corn Price Index (NCI, national average cash price) extended its major (long-term) downtrend to a low of $4.1805 during January before closing at $4.2675, down 15.69 cents for the month. While the market remains sharply oversold, with monthly stochastics in single digits, the index has show no sign of completing a bullish reversal. This could happen at any time, though, unless we are waiting for a new 4-month high. Theoretical Positions: If cash needs were bought at the end of May, the previous suggestion was to buy put options as protection, establishing a synthetic call. Otherwise, continue to buy cash corn as needed only until a clear bullish reversal is completed.
December Corn: Dec24 spent January consolidating within the combined range of Dec23 and Dec24 during December. My concern over the fall read of a new 4-month high, due to the carry in the Dec-Dec spread as the 2023 issue expired, seems to have been confirmed last month. Heading into February, Dec24 is in a range between the 4-month low of $4.47 and December’s high of $5.13.
Theoretical Positions:
- Hedgers:
- Dec23 hedges were likely rolled to March24 at a strong carry.
- Dec24 and Dec25 hedges established during 2022 continue to be held. We will need to be careful if Dec24 completes a long-term bullish reversal on the continuous monthly chart.
- Continue to hold these hedges despite the reversal pattern posted during December. However, we will look for an opportunity to cover some of the positions with short-dated new-crop call options.
Teucrium Corn Fund (CORN) extended its major downtrend to a new low of $20.11 during January. This was CORN’s lowest mark since October 2021 despite being sharply oversold, according to monthly stochastics. Theoretical Positions: Buy stops would be placed above the previous 4-month high of $23.24 (October 2023).