
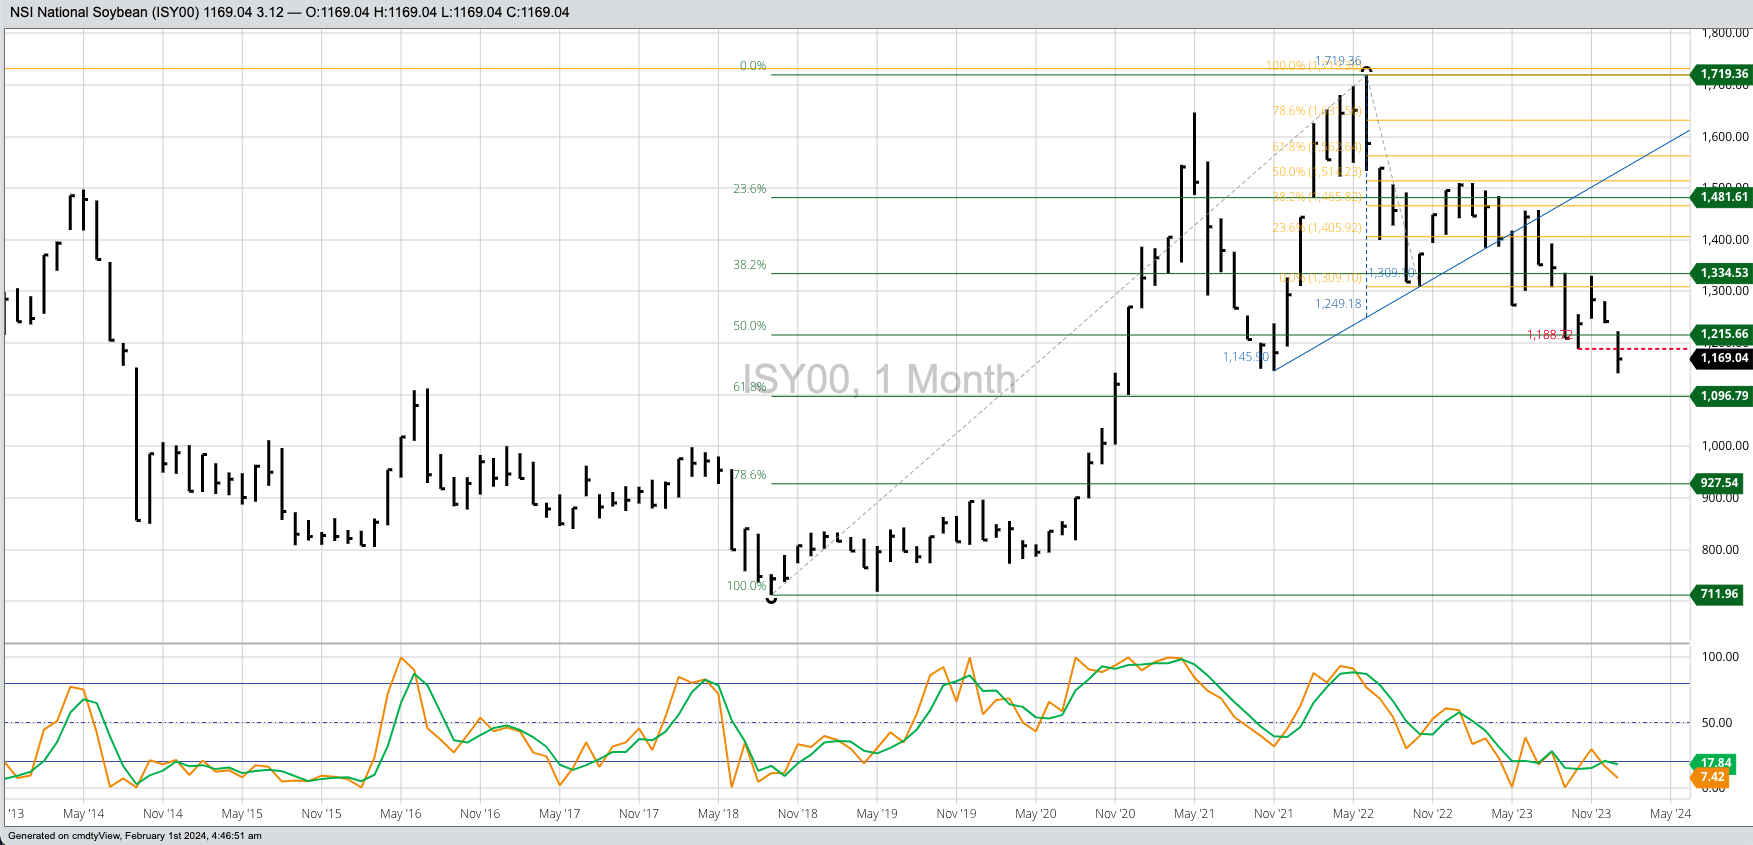


Soybean Cash Index: The Soybean Price Index (ISY00, national average cash price) is a mess. The ISY00 left a price gap on its monthly chart between the December low of $12.3840 and January high of $12.2302. The January low of $11.4172 also took out the previous low of $11.4590 from November 2021. Based on the head and shoulder top pattern completed at the end of April 2023, the downside target is $9.2814 (I will check my math again, but I’ve done it twice so far.) Theoretical Positions: Remaining cash bushels from the 2023 harvest would’ve been sold on sell stops below the October low of $11.8872.
November Soybeans: The November 2024 contract posted a new 4-month low of $11.7325 during January before closing the month at $11.9975, down 46.0 cents for the month. It could be argued the market remains in a major uptrend, with the ongoing move a Wave 2 selloff. If so, it is important for the Nov24 contract to hold the previous low of $11.3050 (May 2023). Theoretical Positions: Given 2024-2025 futures spreads remain bullish, there are likely few sales on the books versus the Nov24 contract. Sell stops might’ve been triggered below the previous 4-month low of $12.5050 (October 2023, the Nov23 contract). Additional stops could be sitting below the May 2023 low of $11.3050 (again posted by the Nov23 contract).
The Teucrium Soybean Fund (SOYB) monthly chart remains a mess. SOYB took out its previous 4-month low of $26.59 during January on its way to a low of $25.07 before closing at $25.73, down $1.28 for the month. Theoretical Positions: Investors might’ve gone long at the June close of $27.32. If so, technically, sell stops would’ve been triggered below the previous 4-month low of $26.59 from October 2023. This would’ve resulted in a loss of $0.74. There are no new positions at the end of January.


