
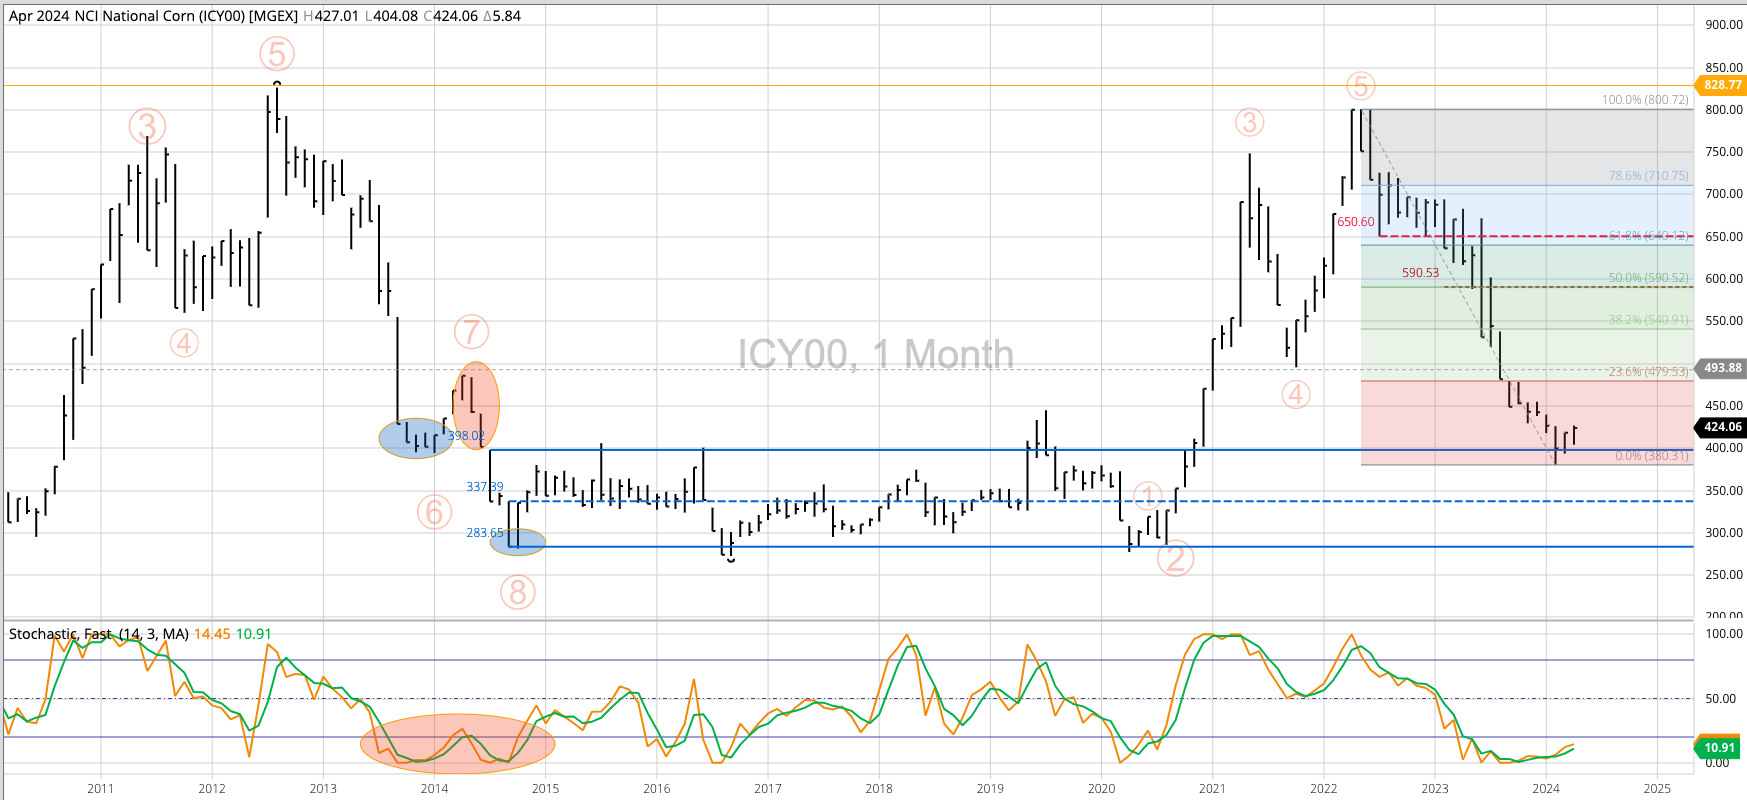


Corn Cash Index: The National Corn Price Index (NCI, national average cash price) still looks to be in a major (long-term) downtrend despite settling higher two consecutive months. Theoretical Positions: Continue to buy cash corn as needed only, with longer-term buy stops above the previous 4-month high near $4.40. The NCI closed April at $4.24.
December Corn: Dec24 also looks to be in a major sideways trend with support at the double bottom lows of $4.47 (November 2023) and $4.46 (December 2023) and resistance the January 2024 high of $5.0225.
Theoretical Positions:
- Hedgers:
- Dec24 and Dec25 hedges established during 2022 and 2023 continue to be held (see Weekly Analysis).
- Some short hedges may have been lifted when Dec24 completed a bullish key reversal on its weekly chart the week of February 26 through March 1.
- If short positions are still held, new-crop short-dated July $4.60 put options were sold for 23.0 cents during March (see Weekly Analysis). These put options closed April at 11 2/8 cents
- Also, short-dated new-crop July $4.80 call options were sold for 21.0 cents. These options closed April at 12.0 cents.
- Dec24 and Dec25 hedges established during 2022 and 2023 continue to be held (see Weekly Analysis).
- Traders:
- Still holding short Dec24 futures after rolling from Dec23 at a strong carry during November 2023.
- Buy stops would be above the January 2024 high of $5.0225.
- Options may have been sold
- New-crop short-dated July $4.60 put options at 23.0 cents
- New-crop short-dated July $4.80 call options at 21.0 cents
Teucrium Corn Fund (CORN) posted another inside month during April. Theoretical Positions: None at this time. Buy stops would be above the previous 4-month high of $21.53 (January 2024).


