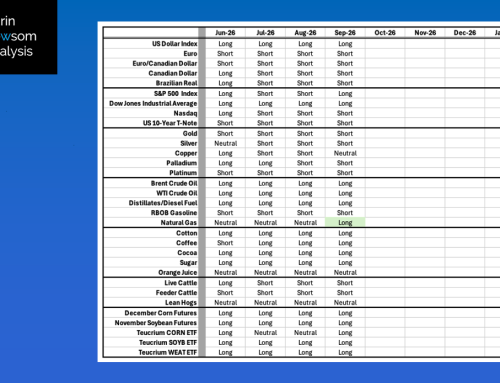
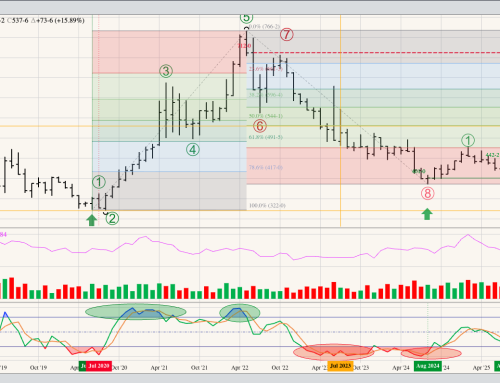
The US dollar index ($DXY): The $DXY remains in a major (long-term) 5-wave uptrend. The December low of 100.62 looks to be the bottom of Wave 2 (of a 5-wave pattern) meaning Wave 3 should take out the Wave 1 high of 107.35 (October 2023). However, the $DXY continues to consolidate within the April range (106.52 to 103.88, close of 106.22) before closing at 105.87, near the June monthly high of 106.13. Theoretical Positions: New long positions would’ve been established as the $DXY hit a new 4-month high during September 2023, roughly 104.70, with positions added as a new 2023 high was set near 105.90. Additional longs could’ve been established during April at a new 4-month high beyond 104.98 (February 2024). This would create an average long of about 105.20, with sell stops below the 4-month low of 102.36 (March 2024).
The euro (^EURUSD): The euro remains in a major 3-wave downtrend with the December 2023 high of 1.11395 looking to be the peak of Wave 7 (Wave B, second wave of the 3-wave pattern). If so, then the euro would be expected to take out the Wave 6 low of 1.04487 (October 2023) with next downside targets at 1.04059 and 1.02007, the 50% and 61.8% retraecment levels respectively of the previous major uptrend from 0.93564 (September 2022) through the high of 1.12754 (July 2023). Theoretical Positions: New short positions would’ve been established near 1.06354. Additional short positions could’ve been established below the 4-month low of 1.06951 during April. If so, the average position would be 1.06652 with buy stops above the 4-month high of 1.09806 (March 2024).
The euro/Canadian dollar (^EURCAD) remains in a major downtrend after completing a bearish 2-month reversal at the end of May 2023, though the monthly chart continues to show a sideways consolidation pattern. The rally seen during November 2023 could still be considered Wave B (second wave) of the 3-wave downtrend pattern. June saw the EURCAD post a bearish outside range, but we’ll see if this generates new selling during July. The previous 4-month low is 1.45469 from April. Theoretical Positions: Traders might’ve liquidated longs from the August 2022 close of 1.31904 near the May 2023 close of 1.45107 (a gain of 0.13203) and establish new short positions (short euro/long Canadian dollar).
The Canadian dollar (^CADUSD) looks to be in a sideways trend, the range between the high of 0.75883 (December 2023) and low of 0.72225 (April 2024). Theoretical Positions: Traders could be long from the October 2022 close of 0.73395 based on a bullish spike reversal. Additional longs might’ve been established near the March 2023 settlement of 0.73975, putting the average long near 0.73685. Also, additional longs may have been established during June as the loonie took out its previous 4-month high of 0.75398. If so, the average long position would now be 0.74256. Sell stops would be below previous 4-month low of 0.72225 from April.
The Brazilian real (^BRLUSD) broke out of its sideways trend and quickly extended its major downtrend during June. With monthly stochastics below the oversold level of 20%, the real is in position to establish a Wave C low (third wave of a 3-wave downtrend). the previous low is at 0.17370 from December 2021. Theoretical Positions: Traders may have sold the real on the break below the April 2024 low of 0.18904 during June.