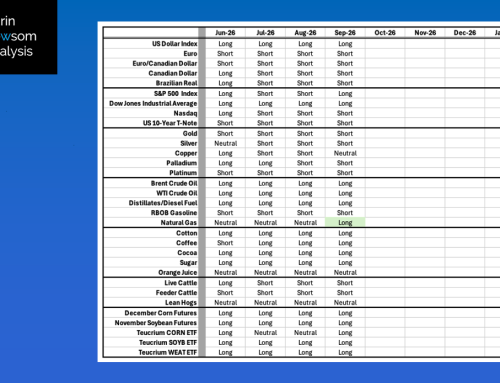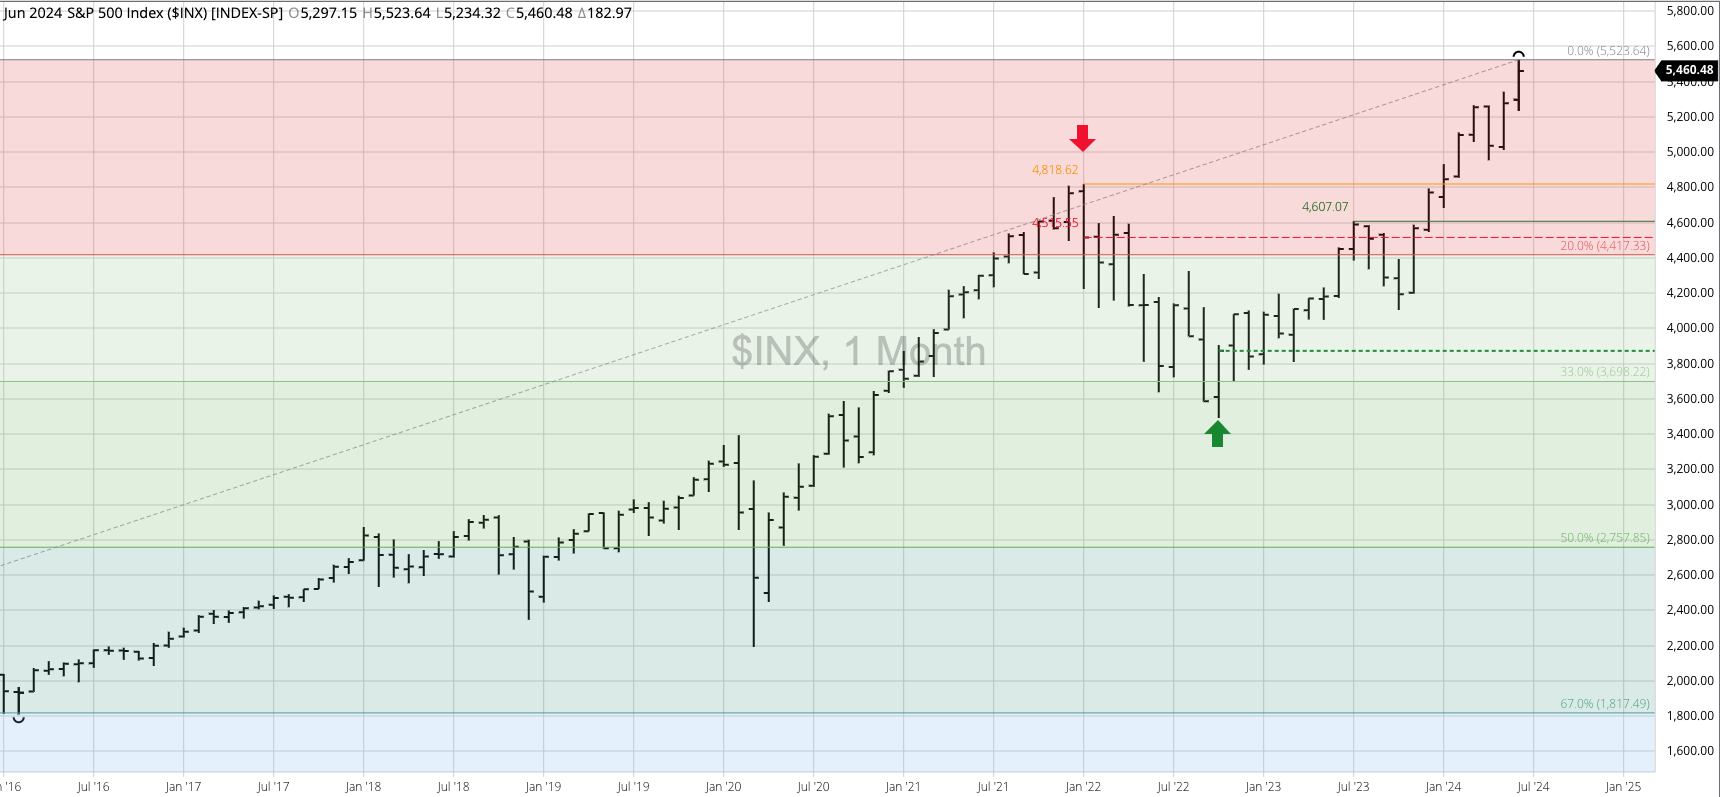


The S&P 500 ($INX) extended its major (long-term) uptrend to a high of 5,523.64 during June before closing at 5,460.48. Theoretical Positions: Long from the October 2022 close of 3,871.98. Sell stops could be place below the previous 4-month low of 4,953.56 (April 2024). A 20% retracement is down at 4,418.91. Recall the old definition of a “bear market” is a retracement of 20% or more.
The Dow Jones Industrial Average ($DOWI) remains in a major uptrend, though it did consolidate within the May range during June. Theoretical Positions: Long from at least the October 2022 settlement of 32,732.95 if not the breakout of the September high at 32,504.04. Sell stops could be placed below the previous 4-month low of 37,611.56 (April 2024).
The Nasdaq ($NASX) extended its major uptrend to a high of 18,030.88 during June before closing at 17,732.60. Theoretical Positions: Long from the October 2022 close of 10,988.15. Sell stops could be placed below the previous 4-month low of 15,222.78 (April 2024).
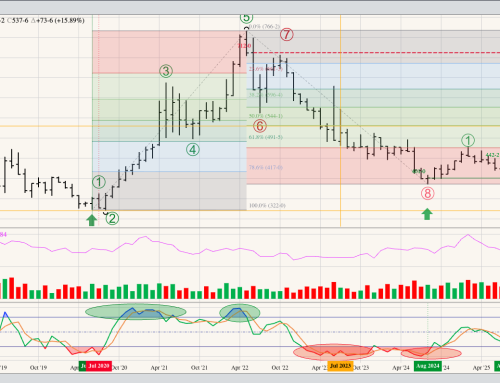
The US 10-year T-note (ZN) remains in a major uptrend with the April low of 107-040 a test of the downside target of 107-016. The latter is the 78.6% retracement level of the Wave 1 rally from 105-105 (October 2023) through the high of 113-120 (December 2023). Wave 2 selloffs tend to see a deep retracement of Wave 1, often reaching near 80%. Wave 3 is expected to take out the Wave 1 high of 113-120 from December 2023. Theoretical Positions: New longs might’ve been established near the November 2023 close of 109-150. Additional positions could’ve been established near the April close of 107-140, creating an average position of 108-145. Sell stops would be placed below the April 2024 low of 107-040.