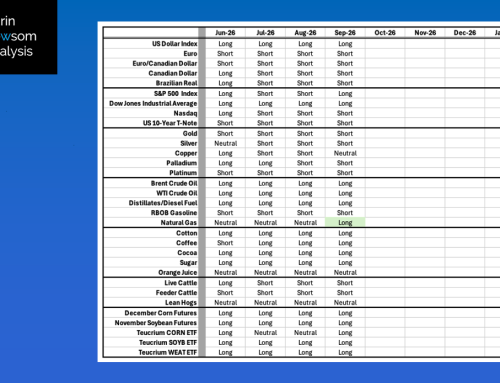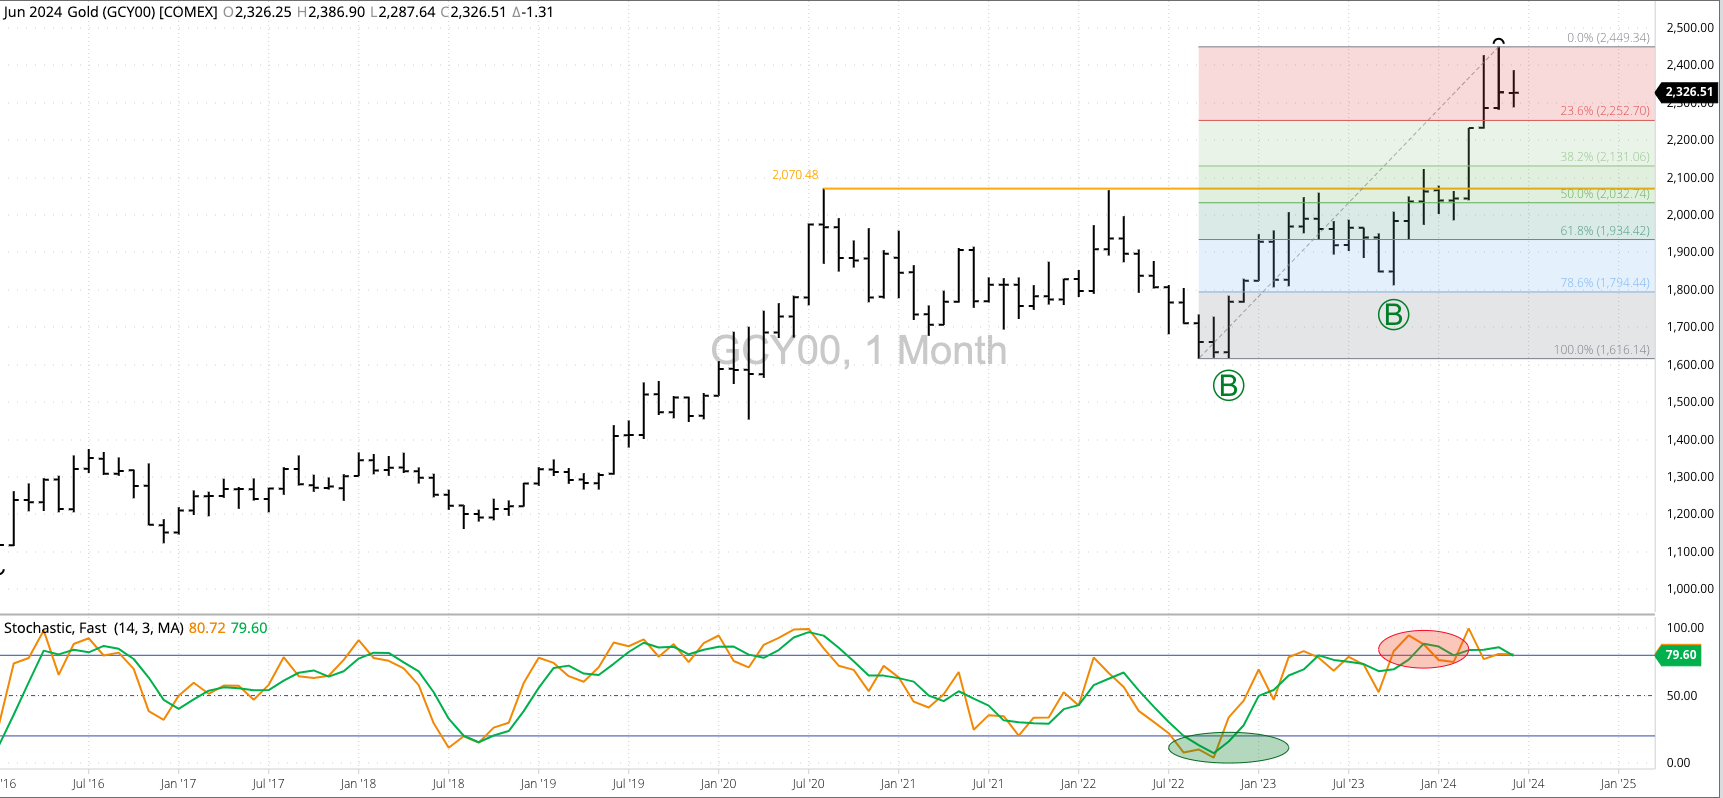


Gold (Cash Index): The cash index (GCY00) still looks to be in a major (long-term) uptrend, though the index consolidated below the May high of $2,449.34 during June. Monthly stochastics remain above the overbought level of 80% indicating the trend could soon turn down. Theoretical Positions: It’s possible investment traders bought near the October 2023 close of $1,983.91 as previous short positions were stopped out.
Silver (Cash Index): The cash index (SIY00) still looks to be in a major uptrend, though the argument could be made activity during June completed a bearish 2-month reversal. I’m not on that side of the fence yet given the May settlement of $30.4075 was not near the monthly high of $32.3678. Theoretical Positions: Traders might’ve gone long as a new 4-month high ($25.7691) was posted during April. Based on the possible bearish 2-month reversal during May and June, traders could look at liquidation longs near the June close of $29.1418 for a gain of roughly $3.3727.
Copper (Cash Index): The cash index (HGY00) extended its major uptrend to a high of $5.1225 during May before closing at $4.6150. While still settling higher for the month it was well off the monthly high, opening the door to possible selling during June. This did occur as the index fell to a low of $4.3170 before closing at $4.3995. Next support is pegged at $4.1665. Theoretical Positions: It’s possible investment traders bought as the new 4-month high was posted during December, and again as the contract took out its 4-month high of $3.9410 during March. Additional longs may have been added during April as the index hit another new 4-month high beyond $4.1195. If so, the average position would be near $3.9850. It’s possible traders liquidated longs at May’s close of $4.6150, expecting a continued selloff during June. If so, this would’ve locked in a gain of roughly $0.63.