
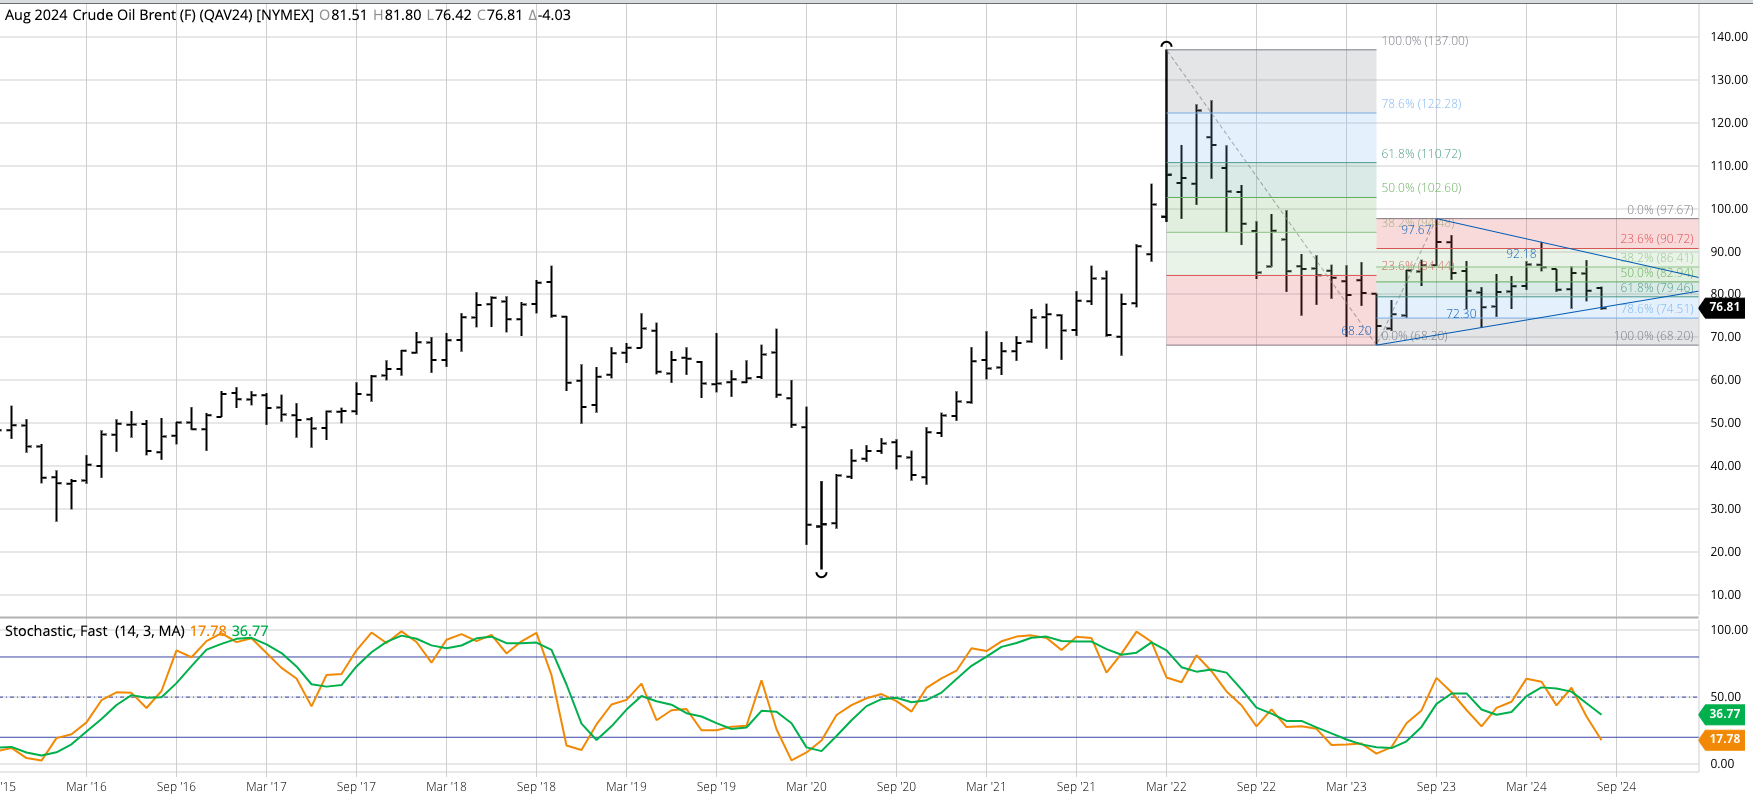


Brent crude (QA) is in a major (long-term) sideways trend. I’ve changed my view on Brent (and most of the rest of the Energies sector) based on markets having difficulty maintaining upside momentum. For now, I’ll call the range between the September 2023 high of $97.67 and May 2023 low of $68.20, a range of roughly $30. We also see this consolidation between lower highs and lower lows indicating the market will break out at some point. Theoretical Positions: Previous short futures were covered and new longs established as the spot-month contract took out the previous 4-month high of $87.49 during August 2023. This has longs at roughly $87.50. Additional longs could’ve been established near the January close of $80.55 based on the idea Wave 2 has bottomed. This puts the average long position at roughly $84.00. Sell stops would be below the 4-month low of $76.75 (June 2024). These stops would’ve been triggered early in August. Otherwise, traders might have moved to the sidelines, waiting for a breakout.
WTI crude oil (CL) is also in a major sideways trend, also consolidating between converging trendlines. The long-term range is between the May 2023 low of $63.57 and September 2023 high of $95.03. Theoretical Positions: Long positions were established on the move above the previous 4-month high of $83.53 (April 2023). Additional longs could’ve been established near the January 2024 close of $75.85 on the idea Wave 2 has bottomed. The average position would be near $79.70. Sell stops would be below the June 2024 low of $72.48. Otherwise, traders might have moved to the sidelines, waiting for a breakout.
Distillates (HO, heating oil, diesel fuel, jet fuel, etc.) still look to be in a major uptrend, with the spot-month contract extending the Wave 2 sell0ff to a low of $2.2565 during June. However, this was part of what turned out to be a bullish key reversal indicating the market is set to begin a Wave 3 rally. If so, then it would be expected to take out the Wave 1 high of $3.5092 (September 2023). Theoretical Positions: Traders could be long just above the previous 4-month high of $2.9198. Additionally, those needing to cover diesel needs might’ve done so near the January close of $2.7852 based on the idea Wave 2 has bottomed. If traders were stopped out below the December 2023 low of $2.4838 (for a loss of 43.6 cents), then new long positions could be established near the June close of $2.5331. Sell stops would then be placed below the June 2024 low of $2.2565.
RBOB gasoline (RB) remains in a major 5-wave uptrend. Theoretical Positions: Traders likely established long futures positions above the previous 4-month high of $2.5810. Additional longs could be added near the June settlement of $2.5015. If so, then the average long would be roughly $2.5415. Sell stops would be placed below the previous low of $1.9672 (December 2023). Others may have sell stops below the previous 4-month low of $2.2984 (June).
Natural gas (NG) looks to be in a major uptrend after posting a new 4-month high during June. However, the market looks to be immediately moving into a Wave 2 selloff meaning a test of the previous low of $1.522 is possible. Theoretical Positions: Traders might’ve gone long on the bullish breakout above $2.168 during May, the high from February 2024. Additional long positions may have been established above the May high of $2.924 during June. If so, then the average long position would be roughly $2.547. Others may be waiting for a Wave 2 selloff back to near $1.872 to go long.


