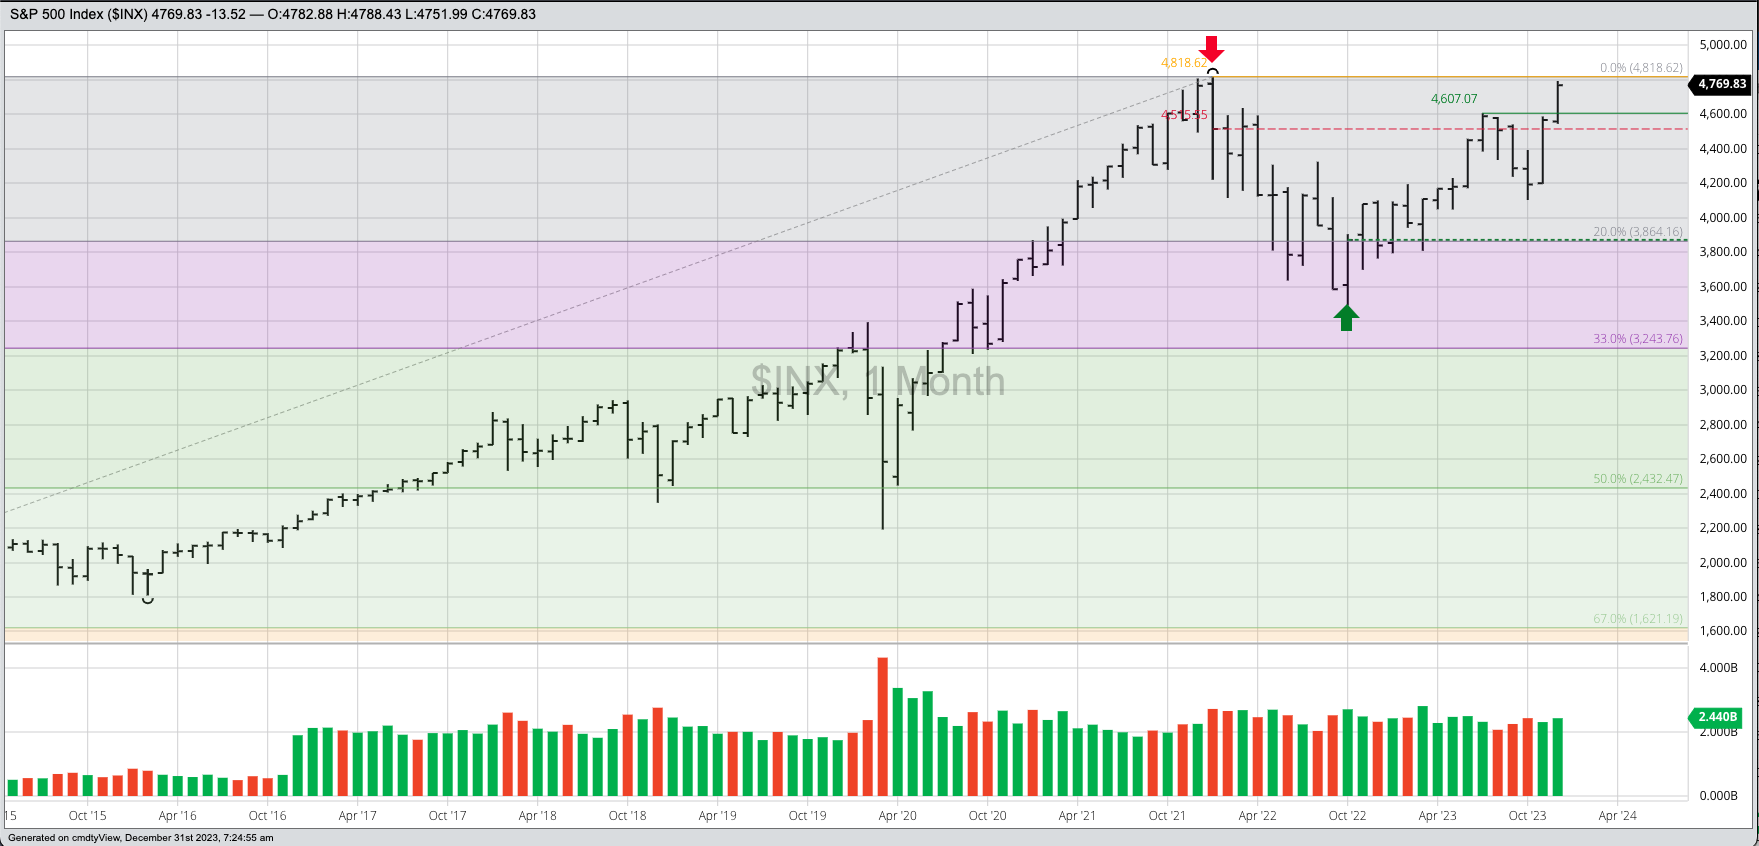


The S&P 500 ($INX) remains in a major (long-term) uptrend. December saw the $INX post a high of 4,793.30, just short of its all-time high of 4,818.62 from January 2022. However, the monthly close for December 2023 of 4,769.83 was a new record high monthly close, taking out the December 2021 mark of 4,766.18. The stage is set for what could be a critical month for the $INX: Does it follow the 2021-2022 pattern and begin a new downtrend? Or, does it continue to extend this uptrend as investment money starts to flow out of other sectors (money markets, commodities, etc.)? We will soon find out. As I said before, for not the major trend remains up. Theoretical Positions: Long from the October 2022 close of 3,871.98.
The Dow Jones Industrial Average ($DOWI) posted a new all-time high of 37,778.85 during December before closing at 37,689.54. Theoretical Positions: Long from at least the October 2022 settlement of 32,732.95 if not the breakout of the September high at 32,504.04.
The Nasdaq ($NASX) remains in a major uptrend. The $NASX posted a high of 15,150.07 during December, still roughly 6.5% below its all-time high of 16,212.23 from November 2021. Theoretical Positions: Long from the October 2022 close of 10,988.15.
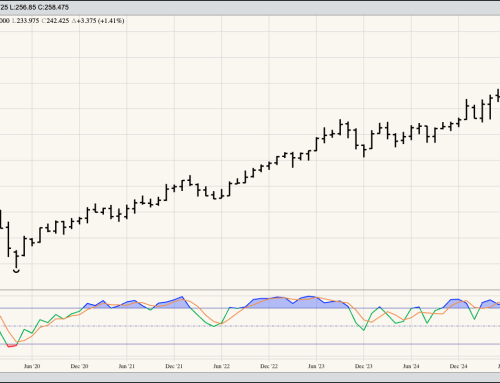
The US 10-year T-note (ZN) extended its new major 5-wave uptrend to a high of 113-120 during December. This move could still be considered Wave 1 of the pattern, meaning a Wave 2 selloff could begin at any time. Initial resistance is at the series of highs from March through May 2023 near 117-000, with the next upside target near 118-275. The latter marks the 38.2% retracement level of the previous major downtrend from 140-235 (March 2020) through the low of 105-105 (October 2023). Theoretical Positions: New longs might’ve been established near the November 2023 close of 109-150. Others may be waiting for a retracement. Either way, sell stops would be placed below the October 2023 low of 105-105.
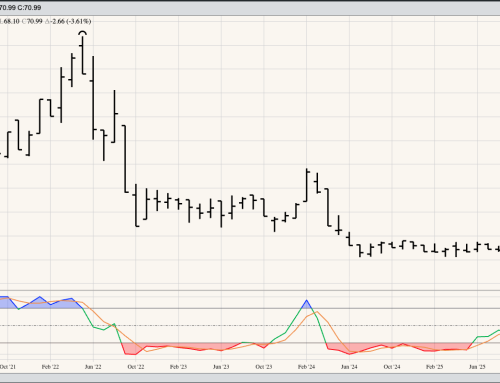
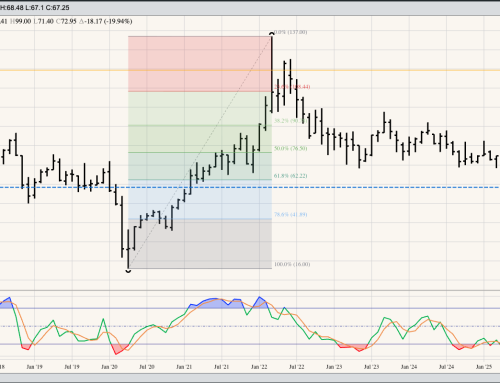
Gold (Cash Index): Gold (Cash Index): The cash index hit a new all-time high of $2,122.65 during December before falling back to close the month at $2,062.94. While still up $26.72 for the month, it was back below the previous high of $2,070.48 (August 2020). Additionally, it was enough for months stochastics to establish a bearish crossover above the overbought level of 80%, a signal the major trend could be set to turn down. If so, this would fit with the macro view that investment money could flow out of commodities and into equities and Treasuries during 2024. However, global turmoil is expected to increase this coming year as well*, possibly keeping interest in cash gold as a safe-have market. Theoretical Positions: It’s possible investment traders bought near the October 2023 close of $1,983.91 as previous short positions were stopped out.
* My year end piece for Barchart discussed this scenario in more detail (LINK).