
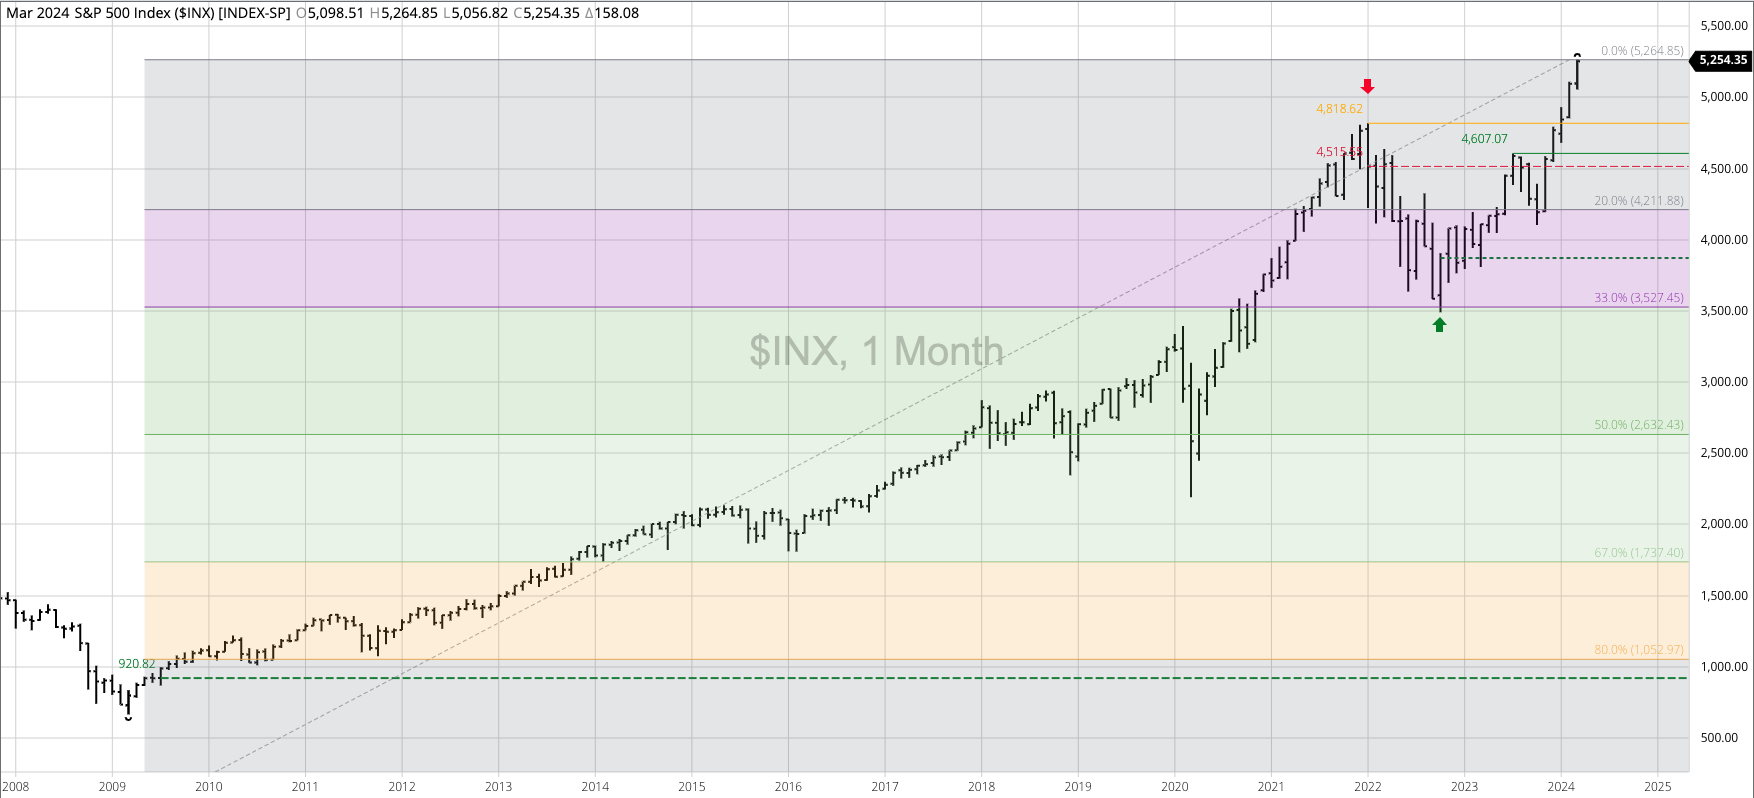


The S&P 500 ($INX) extended its major (long-term) uptrend to a high of 5,264.85 before closing March at 4,254.35, up 158.08 for the month. Theoretical Positions: Long from the October 2022 close of 3,871.98. Sell stop below the previous 4-month low of 4,546,50 (December 2023).
The Dow Jones Industrial Average ($DOWI) extended its major uptrend to a high of 39,889.05 before closing March at 39,807.37, up 810.98 for the month. Theoretical Positions: Long from at least the October 2022 settlement of 32,732.95 if not the breakout of the September high at 32,504.04. Sell stops would be below the previous 4-month low of 35,914.45 (December 2023).
The Nasdaq ($NASX) extended its major uptrend to a high of 16,538.86 before closing March at 16,379.46, up 287.54 for the month. Theoretical Positions: Long from the October 2022 close of 10,988.15. Sell stops would be placed below the previous 4-month low of 14,058.94 (December 2023).
The US 10-year T-note (ZN) remains in a major uptrend with the lower close at the end of March the third consecutive lower monthly settlement. This brings to mind a Benjamin Franklin Fish Analogy, meaning the market could start moving up again. The March low of 109-115 was a test of the Wave 1 retracement level of 109-112. This leaves the door open to a possible extension of the Wave 2 selloff early in April before rallying. Eventually, the market will move into a Wave 3 rally that should take it above the Wave 1 high of 113-120. Theoretical Positions: New longs might’ve been established near the November 2023 close of 109-150. Additional positions could be established near the March close of 109-215. Sell stops would be kept below the October 2023 low of 105-105.


